
Page 4 - 2018 Kent Property Marke Report
P. 4
CAXTONS’ PROPERTY MARKET ANALYSIS
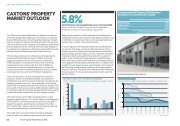
Components of All Property IPF total return forecast for UK Commercial Property
Annualised average over period 2018-2022
Rental growth
1.0%
Capital return
0.0%
Total return
4.8%
Source: Investment Property Forum Survey of Independent Forecasts for UK Commercial Property, August 2018. Forecasts derived from 24 leading fund/investment managementhouses and consultancies
CAXTONS’ PROPERTY MARKET OUTLOOK
The UK economy has proved relatively resilient over the last
12 months despite the backdrop of uncertainty, not only as a result of Brexit, but also a mounting global trade war. Overall economic output is expected to show growth in the region of 1.4% for 2018 as a whole. However, the multiplicity of domestic and international events, combined with structural change in the retail sector in particular, is delivering wide variations in the performance of individual segments of the economy.
The manufacturing sector continues to be helped by the weaker pound although business confidence surveys suggest a subdued outlook, with business investment remaining weak. In contrast, the service sector showed
a robust performance during the first half of 2018 and maintained momentum over the summer. The short to medium term outlook remains positive but will to an extent be dictated by the outcome of the Brexit negotiations.
The consumer sector, which is so important to the UK economy, remains challenged. Despite record levels of employment and some real income growth, households are navigating a difficult period. This is reflected in the Savings Ratio which has dipped well below the long run average. The small uplift in the base rate during 2018 will add to debt costs. It is therefore likely that consumer spending and the housing market will remain subdued for the next couple of years.
The UK property sector reflects the disparities in wider economic performance. The UK All Property Total Return for 2017 was 9.6%, more than double the previous year (MSCI). Despite the positive performance recorded in the office
and, in particular, industrial sector, the All Property year end outcome was diluted by a weak retail sector.
This weakness is echoed in the Kent market, although there are also many positive stories across the county.
5.8%
UK All Property annualised total return forecast 2018
Source: Investment Property Forum Survey of Independent Forecasts for UK Commercial Property, August 2018
Regeneration projects, active management strategies and increased housing in town centres have added to vitality. This is reflected in a lowering of the county’s average high street vacancy rate, counter to the national trend.
In some respects, the industrial market has benefited from the structural change occurring in the retail sector. This is evident across the county, with the demand for distribution space having a positive impact on rents. However, the wider industrial market is also performing well with an upturn in higher value activities placing pressure on available space. With rents having risen by 24% over the last five years there is more appetite for speculative development. In a market with a dearth of such opportunities, assets that do come forward are attracting strong investor interest and having a positive impact on pricing. The distribution and industrial markets are the only sectors in the county to see yields harden over the last 12 months.
Carlton Road Business Park, Ashford.
UK total return IPF consensus forecasts
Office Industrial Standard Retail 14
12 10 8 6 4 2 0
Retail Warehouse All Property
2018
2019
2020
Source: Investment Property Forum Survey of Independent Forecasts for UK Commercial Property, August 2018. Forecasts derived from 24 leading fund/investment management houses and consultancies
Kent prime yields
Industrial Multi-let
10 9.0 8.0 7.0 6.0 5.0
Industrial Distribution
Offices Business Parks
Source: Caxtons
02 Kent Property Market Report 2018
H1 2013 H2 2013 H1 2014 H2 2014 H1 2015 H2 2015 H1 2016 H2 2016 H1 2017 H2 2017 H1 2018
% Per annum
% Yield
ASHFORD BOROUGH COUNCIL
