
Page 159 - PhD GT
P. 159
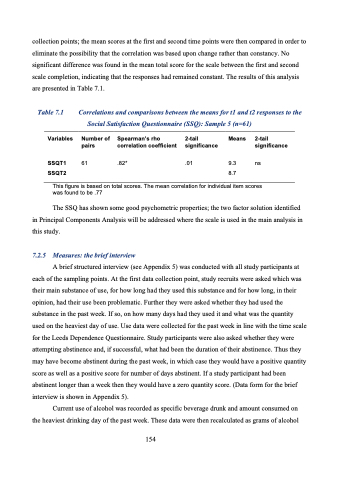
collection points; the mean scores at the first and second time points were then compared in order to eliminate the possibility that the correlation was based upon change rather than constancy. No significant difference was found in the mean total score for the scale between the first and second scale completion, indicating that the responses had remained constant. The results of this analysis are presented in Table 7.1.
Table 7.1
Variables
SSQT1 SSQT2
Correlations and comparisons between the means for t1 and t2 responses to the Social Satisfaction Questionnaire (SSQ): Sample 5 (n=61)
      Number of pairs
61
Spearman’s rho 2-tail correlation coefficient significance
.82* .01
Means 2-tail significance
9.3 ns 8.7
      This figure is based on total scores. The mean correlation for individual item scores was found to be .77
The SSQ has shown some good psychometric properties; the two factor solution identified in Principal Components Analysis will be addressed where the scale is used in the main analysis in this study.
7.2.5 Measures: the brief interview
A brief structured interview (see Appendix 5) was conducted with all study participants at each of the sampling points. At the first data collection point, study recruits were asked which was their main substance of use, for how long had they used this substance and for how long, in their opinion, had their use been problematic. Further they were asked whether they had used the substance in the past week. If so, on how many days had they used it and what was the quantity used on the heaviest day of use. Use data were collected for the past week in line with the time scale for the Leeds Dependence Questionnaire. Study participants were also asked whether they were attempting abstinence and, if successful, what had been the duration of their abstinence. Thus they may have become abstinent during the past week, in which case they would have a positive quantity score as well as a positive score for number of days abstinent. If a study participant had been abstinent longer than a week then they would have a zero quantity score. (Data form for the brief interview is shown in Appendix 5).
Current use of alcohol was recorded as specific beverage drunk and amount consumed on the heaviest drinking day of the past week. These data were then recalculated as grams of alcohol
154
