
Page 197 - PhD GT
P. 197
between t1 and t2 and between t1 and t3 (p< .001 in both cases) but no significant differences in the means of these two parts of the scale between t2 and t3. Given the significant correlations among different parts of the scale and dependence scores reported below, it is likely that difference in the means is unable to reflect the changes that are occurring as discussed above with reference to the changes in dependence.
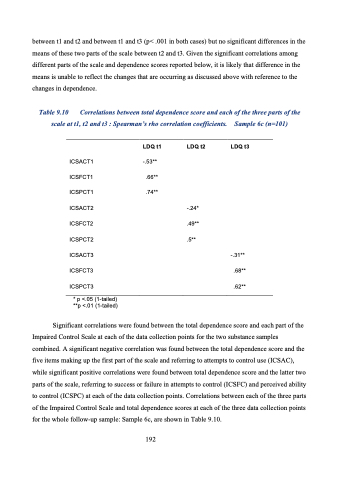
Table 9.10 Correlations between total dependence score and each of the three parts of the
scale at t1, t2 and t3 : Spearman’s rho correlation coefficients.
Sample 6c (n=101)
LDQ t3
ICSACT1
ICSFCT1
ICSPCT1
ICSACT2
ICSFCT2
ICSPCT2
ICSACT3
ICSFCT3
ICSPCT3
* p <.05 **p <.01
LDQ t1
-.53** .66** .74**
LDQ t2
-.24* .49** .5**
-.31** .68** .62**
(1-tailed) (1-tailed)
Significant correlations were found between the total dependence score and each part of the Impaired Control Scale at each of the data collection points for the two substance samples combined. A significant negative correlation was found between the total dependence score and the five items making up the first part of the scale and referring to attempts to control use (ICSAC), while significant positive correlations were found between total dependence score and the latter two parts of the scale, referring to success or failure in attempts to control (ICSFC) and perceived ability to control (ICSPC) at each of the data collection points. Correlations between each of the three parts of the Impaired Control Scale and total dependence scores at each of the three data collection points for the whole follow-up sample: Sample 6c, are shown in Table 9.10.
192
