
Page 256 - PhD GT
P. 256
Appendix 6
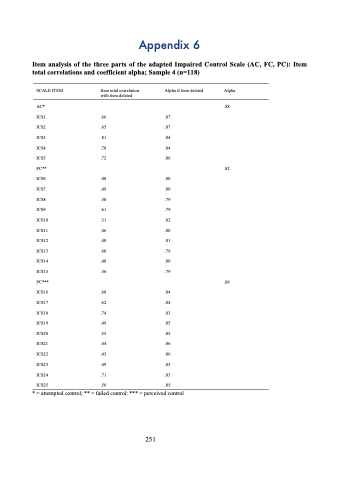
Item analysis of the three parts of the adapted Impaired Control Scale (AC, FC, PC): Item total correlations and coefficient alpha; Sample 4 (n=118)
SCALE ITEM
AC* ICS1 ICS2 ICS3 ICS4 ICS5 FC** ICS6 ICS7 ICS8 ICS9 ICS10 ICS11 ICS12 ICS13 ICS14 ICS15 PC*** ICS16 ICS17 ICS18 ICS19 ICS20 ICS21 ICS22 ICS23 ICS24 ICS25
Item total correlation with item deleted
.66 .65 .81 .78 .72
.48 .49 .58 .61 .31 .46 .40 .60 .48 .56
.68 .62 .74 .49 .55 .44 .43 .49 .71 .56
Alpha if item deleted Alpha .88
.87 .87 .84 .84 .86
.80 .80 .79 .79 .82 .80 .81 .79 .80 .79
.84 .84 .83 .85 .85 .86 .86 .85 .83 .85
.82
.86
* = attempted control; ** = failed control: *** = perceived control
251
