
Page 19 - 2016 Company Overview
P. 19
$3.0B $2.5B $2.0B $1.5B $1.0B $0.5B
50%
1976
1980
1985
1990
1995
2000
2005
2010
2015
2020
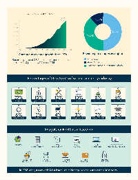
Annual Revenue 1976 − 2016
Continuous revenue growth since 1976
Revenue percentages by region
Americas
Asia Paci c
Europe, Middle East and Africa
US$3.2B 2016
13.4%
36.6%
Record revenue of $3.2 billion up 4 percent constant currency (1.3 percent USD) over 2015.
Percentages of 2016 SAS® software revenue by industry
27% 15% 12% 10% 8% 6% banking government services insurance life sciences communications
6% 5% 4% 3% 2% 2% manufacturing health care retail energy & utilities capital markets education
Analysts rank SAS as a leader in:
Analytics Data Management
Customer Retail Intelligence Analytics
Data Integration
Business Intelligence
Data Quality
Digital Advanced and Marketing Predictive Analytics
Security Solutions
Fraud Detection
In 2016, analysts ranked SAS a leader or leader equivalent in more than 30 reports.
