
Page 9 - Catch_Return24_25
P. 9
Alright, let's create a report based on the "Blackwell" fish catch data, following the same style as the
previous reports.
Report: Fish Catch Analysis at Blackwell
Introduction:
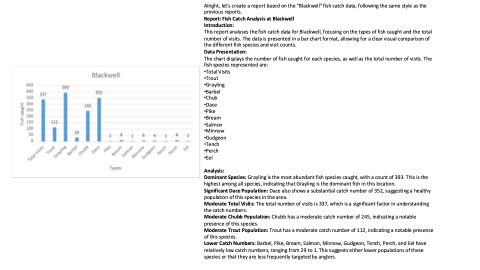
This report analyses the fish catch data for Blackwell, focusing on the types of fish caught and the total
number of visits. The data is presented in a bar chart format, allowing for a clear visual comparison of
the different fish species and visit counts.
Data Presentation:
The chart displays the number of fish caught for each species, as well as the total number of visits. The
fish species represented are:
•Total Visits
•Trout
•Grayling
•Barbel
•Chub
•Dace
•Pike
•Bream
•Salmon
•Minnow
•Gudgeon
•Tench
•Perch
•Eel
Analysis:
Dominant Species: Grayling is the most abundant fish species caught, with a count of 393. This is the
highest among all species, indicating that Grayling is the dominant fish in this location.
Significant Dace Population: Dace also shows a substantial catch number of 352, suggesting a healthy
population of this species in the area.
Moderate Total Visits: The total number of visits is 337, which is a significant factor in understanding
the catch numbers.
Moderate Chubb Population: Chubb has a moderate catch number of 245, indicating a notable
presence of this species.
Moderate Trout Population: Trout has a moderate catch number of 112, indicating a notable presence
of this species.
Lower Catch Numbers: Barbel, Pike, Bream, Salmon, Minnow, Gudgeon, Tench, Perch, and Eel have
relatively low catch numbers, ranging from 29 to 1. This suggests either lower populations of these
species or that they are less frequently targeted by anglers.
