
Page 18 - Tata Steel One Report 2024-Eng-Ebook HY
P. 18
Business Operation and Performance Driving Business Towards Sustainability Corporate Governance Policy Financial Statements Attachments
Distribution of Revenues
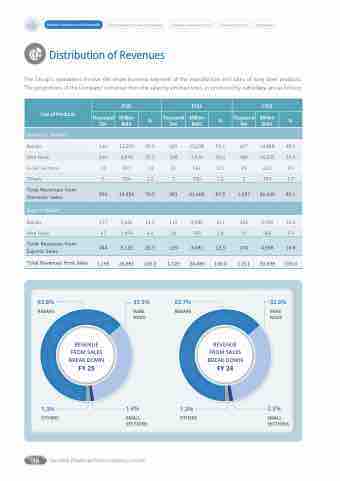
The Group’s operations involve the single business segment of the manufacture and sales of long steel products. The proportions of the Company’s revenue from the sales by product lines, as produced by subsidiary, are as follows:
Line of Products
FY25
FY24
FY23
Thousand Ton
Million Baht
%
Thousand Ton
Million Baht
%
Thousand Ton
Million Baht
%
Domestic Market
Rebars
616
12,299
49.3
629
13,238
53.6
627
14,848
48.5
Wire Rods
316
6,874
27.5
328
7,509
30.4
384
10,235
33.3
Small Sections
14
357
1.4
21
561
2.3
23
623
2.0
Others
5
326
1.3
3
300
1.2
3
394
1.3
Total Revenues from Domestic Sales
951
19,856
79.5
981
21,608
87.5
1,037
26,100
85.1
Export Market
Rebars
177
3,632
14.5
115
2,488
10.1
143
3,696
12.0
Wire Rods
67
1,493
6.0
24
593
2.4
31
902
2.9
Total Revenues from Exports Sales
244
5,125
20.5
139
3,081
12.5
174
4,598
14.9
Total Revenues from Sales
1,195
24,981
100.0
1,120
24,689
100.0
1,211
30,698
100.0
63.8%
REBARS
33.5%
WIRE RODS
63.7%
REBARS
32.8%
WIRE RODS
REVENUE FROM SALES BREAK DOWN FY 25
REVENUE FROM SALES BREAK DOWN FY 24
1.3%
OTHERS
1.4%
SMALL SECTIONS
1.2%
OTHERS
2.3%
SMALL SECTIONS
16 Tata Steel (Thailand) Public Company Limited
