
Page 187 - Tata Steel One Report 2024-Eng-Ebook HY
P. 187
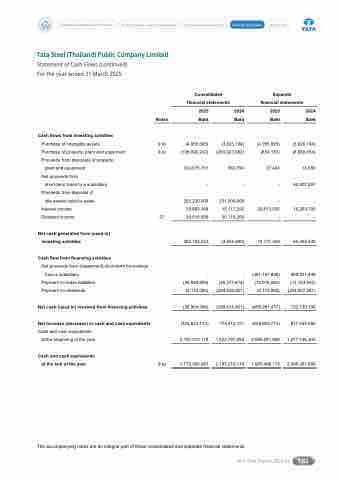
 Tata Steel (Thailand) Public Company Limited
Business Operation and Performance Driving Business Towards Sustainability Corporate Governance Policy Financial Statements Attachments Statement of Financial Position
           As at 31 March 2025
Tata Steel (Thailand) Public Company Limited
Tata Steel (Thailand) Public Company Limited
Statement of Cash Flows (continued) Statement of Cash Flows (continued)
Consolidated Separate financial statements financial statements
2025 2024 2025 2024
Baht Baht Baht Baht Consolidated Separate
For the year ended 31 March 2025
For the year ended 31 March 2025
Assets
Current assets
Notes
9 a) 10 12 13
financial statements
2025 2024
Baht Baht
financial statements 2025
Baht
 Cash and cash equivalents
Notes
1,772,586,997
2,197,210,110
1,645,488,176
2024 Baht
2,095,291,890
58,816,630 (3,826,194)
- (8,989,654)
434,438
14,380 2,154,542,958
62,807,207
- 16,259,700
-
66,265,439 26,909,214
-
13,419,362
Cash flows from investing activities
Trade and other current receivables, net Purchase of intangible assets
Inventories, net
Purchase of property, plant and equipment
Other current assets
Proceeds from disposals of property,
plant and equipment
3,243,038,377
9 d) (4,955,695) (3,826,194)
3,611,081,364 3,058,869,599
9 d) (198,096,242) (283,923,982)
208,710,052 251,901,510
35,930,913 (4,955,695)
- (854,135)
1,041,362
Total current assets
27,443 -
Net proceeds from
short-term loans to a subsidiary
-
202,230,000 20,893,169 38,016,000
-
231,000,000 15,117,292 36,115,200
NoPnro-cuererdesnftroamssdeitssposal of idle assets held-for-sales
Interest income
Financial assets measured at fair value
Dividend income
through other comprehensive income
Investment in a subsidiary
- 20,513,635
-
Net cash generated from (used in)
2,455,095,091 2,509,073,386
382,762,933 (4,954,890) 567,905,121 616,284,401
3,456,014,092 3,456,014,092
7,623,519
Property, plant and equipment, net
investing activities
14,731,248 20,137,807
-
15,335,908
Right-of-use assets, net Goodwill, net
Cash flow from financing activities
23,359,923 53,558,482 37,226,165
23,432,617
Intangible assets, net
Net proceeds from (repayment) short-term borrowings
Deferred tax assets, net from a subsidiary Other non-current assets
Total non-current assets
19 20
39,895,995 -
17,445,289 (481,187,800)
15,258,120 989,321,448
Payment on lease liabilities Payment on dividends
43,626,270
19,673,917 (12,918,582)
22,096,469 (13,153,462)
Net cash (used in) received from financing activities Total assets
Net increase (decrease) in cash and cash equivalents
Cash and cash equivalents at the beginning of the year
Cash and cash equivalents at the end of the year
(2,175,095) 6,896,038,874 6,917,286,761 12,093,263,714
(38,804,994) (290,414,801) (496,281,477) 15,731,455,664 15,297,353,169 13,775,724,165
(254,037,241) 12,100,219,171
722,130,745 14,254,762,129
817,545,585 1,277,746,305
2,095,291,890
11
14
15
16
17
18
27
302,880,000 228,960,000 -
- 12,013,047,274 9,488,732
 The accompanying notes are an integral part of these consolidated and separate financial statements.
9 a)
(424,623,113) 2,197,210,110
1,772,586,997
774,412,151 1,422,797,959
2,197,210,110
(449,803,714) 2,095,291,890
1,645,488,176
2,872,085,189
324,675,701 562,794 8,835,416,790 8,380,066,408 1,682,460,451
- - 12,013,047,274
- (36,629,899) (36,377,874) (2,175,095) (254,036,927)
 56-1 One Report 2024-25 185
The accompanying notes are an integral part of these consolidated and separate financial statements.
