
Page 7 - Tata Steel One Report 2024-Eng-Ebook HY
P. 7
Business Operation and Performance Driving Business Towards Sustainability Corporate Governance Policy Financial Statements Attachments
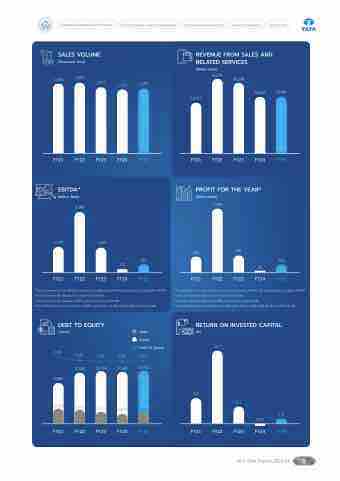
SALES VOLUME
(Thousand Tons)
1,303 1,333 1,211
FY21 FY22 FY23 FY24
EBITDA*
(Million Baht)
3,188
REVENUE FROM SALES AND RELATED SERVICES
1,120 1,195
(Million Baht)
32,590 30,698
FY23 FY24 FY25 PROFIT FOR THE YEAR*
22,017
24,689 24,981
FY25
FY21 FY22
(Million Baht)
1,320 1,029
172
FY21 FY22 FY23 FY24
632
2,606
687
426
FY25
333 96
*The adjustment of one-off items as below included in profit for the year but not included in EBITDA: FY25 Gains from the disposal of unused land 260 MB.
FY24 Gains from the disposal of MBF assets held for sale 220 MB.
FY21-FY23 Provision for impairment of MBF assets FY21 117 MB, FY22 81 MB and FY23 49 MB.
RETURN ON INVESTED CAPITAL
FY21 FY22
FY23 FY24 FY25
DEBT TO EQUITY
(Times)
0.32 9,880 3,120
Debt
Equity
Debt to Equity
0.21 0.21
13,002
2,676 2,730
(%)
8.8
6.2
24.7
0.23 12,580
2,913
0.21 12,764
2,719
FY23
12,621
FY21 FY22
FY24
FY25
FY21 FY22
1.3 (0.9)
FY23 FY24 FY25
56-1 One Report 2024-25 5
