
Page 9 - PSTC - One Report 2023 (EN)
P. 9
8
Power Solution Technologies Public Company Limited
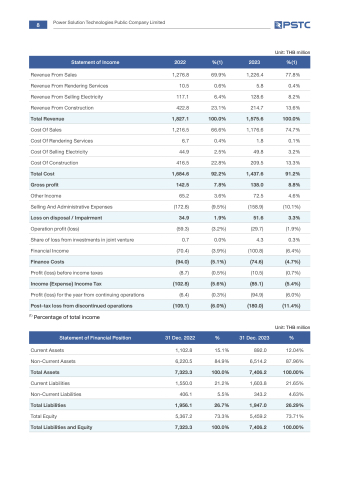
Statement of Income
2022
%(1)
2023
%(1)
Revenue From Sales
Revenue From Rendering Services Revenue From Selling Electricity Revenue From Construction
Cost Of Sales
Cost Of Rendering Services Cost Of Selling Electricity Cost Of Construction
Other Income
Selling And Administrative Expenses
Operation profit (loss)
Share of loss from investments in joint venture Financial Income
Profit (loss) before income taxes
Profit (loss) for the year from continuing operations
(1) Percentage of total income
Current Assets Non-Current Assets
Current Liabilities Non-Current Liabilities
Total Equity
1,276.8
10.5
117.1
422.8 1,216.5
6.7
44.9
416.5
65.2
(172.8) (59.3)
0.7
(70.4) (8.7) (6.4)
1,102.8
6,220.5 1,550.0
406.1 5,367.2
69.9%
0.6%
6.4%
23.1% 66.6%
0.4%
2.5%
22.8%
3.6%
(9.5%) (3.2%)
0.0%
(3.9%) (0.5%) (0.3%)
15.1%
84.9% 21.2%
5.5% 73.3%
1,226.4
5.8
128.6
214.7 1,176.6
1.8
49.8
209.5
72.5
(158.9) (29.7)
4.3
(100.8) (10.5) (94.9)
892.0
6,514.2 1,603.8
343.2 5,459.2
Unit: THB million
77.8%
0.4%
8.2%
13.6% 74.7%
0.1%
3.2%
13.3%
4.6%
(10.1%) (1.9%)
0.3%
(6.4%) (0.7%) (6.0%)
Unit: THB million
12.04%
87.96% 21.65%
4.63% 73.71%
Total Revenue
1,827.1
100.0%
1,575.6
100.0%
Total Cost
1,684.6
92.2%
1,437.6
91.2%
Gross profit
142.5
7.8%
138.0
8.8%
Loss on disposal / Impairment
34.9
1.9%
51.6
3.3%
Finance Costs
(94.0)
(5.1%)
(74.6)
(4.7%)
Income (Expense) Income Tax
(102.8)
(5.6%)
(85.1)
(5.4%)
Post-tax loss from discontinued operations
(109.1)
(6.0%)
(180.0)
(11.4%)
Statement of Financial Position
31 Dec. 2022
%
31 Dec. 2023
%
Total Assets
7,323.3
100.0%
7,406.2
100.00%
Total Liabilities
1,956.1
26.7%
1,947.0
26.29%
Total Liabilities and Equity
7,323.3
100.0%
7,406.2
100.00%
