
Page 23 - Estin Report - MOCKUP
P. 23
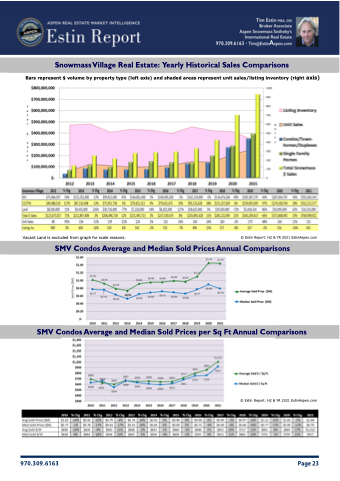
                                                       Snowmass Village Real Estate: Yearly Historical Sales Comparisons
Table of Contents
Bars represent $ volume by property type (left axis) and shaded areas represent unit sales/listing inventory (right axis)
  Vacant Land is excluded from graph for scale reasons. © Estin Report: H2 & YR 2021 EstinAspen.com
  SMV Condos Average and Median Sold Prices Annual Comparisons
  SMV Condos Average and Median Sold Prices per Sq Ft Annual Comparisons
© Estin Report: H2 & YR 2021 EstinAspen.com
Disclaimer: The statements made in The Estin Report and on Aspen broker Tim Estin's blog represent the opinions of the author and should not be relied upon exclusively to make real estate decisions. A potential buyer and/or seller is advised to make an independent investigation of the market and of each property before deciding to purchase or to sell. To the extent the statements made herein report facts or conclusions taken from other sources, the information is believed by the author to be reliable, however, the author makes no guarantee concerning the accuracy of the facts and conclusions reported h erein. Information concerning partic- ular real estate opportunities can be requested from Tim Estin at 970.309.6163 or by email tim@estinaspen.com
The Estin Report is copyrighted 2021 and all rights reserved. Use is permitted subject to the following attribution, The Estin Report on Aspen real estate" with an active link to www.EstinAspen.com
   970.309.6163 Page 23
