
Page 8 - Racial Disparities Taskforce Group 5 Data Summary
P. 8
Asian alone
High school graduate or higher Bachelor's degree or higher
High school graduate or higher Bachelor's degree or higher
High school graduate or higher
Bachelor's degree or higher
Total 499,058
3,027
2,414 1,118
4,770 1,029
79.70% 1,080 36.90% 553
89.80% 2,970 19.40% 559
87.50% 3,494 13.50% 532 263,244
67.10% 34.30%
90.30% 17.00%
91.70% 14.00%
1,334 94.10% 565 39.90%
1,800 88.90% 470 23.20%
3,181 83.30% 500 13.10%
235,814
0.61%
1,610
0.61%
1,417
0.60%
Two or more races
5,314
1.06%
3,289
1.25%
2,025
0.86%
Hispanic or Latino Origin
7,631
6,675 1,032
1.53%
3,810
1.45%
3,821
1.62%
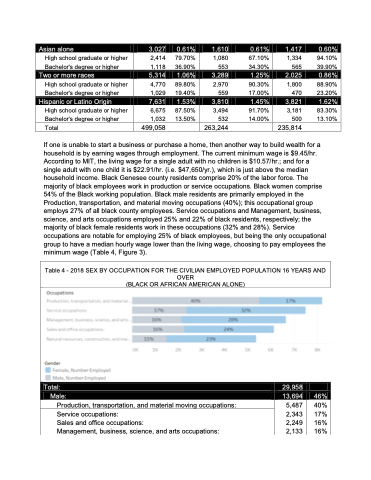
If one is unable to start a business or purchase a home, then another way to build wealth for a household is by earning wages through employment. The current minimum wage is $9.45/hr. According to MIT, the living wage for a single adult with no children is $10.57/hr.; and for a single adult with one child it is $22.91/hr. (i.e. $47,650/yr.), which is just above the median household income. Black Genesee county residents comprise 20% of the labor force. The majority of black employees work in production or service occupations. Black women comprise 54% of the Black working population. Black male residents are primarily employed in the Production, transportation, and material moving occupations (40%); this occupational group employs 27% of all black county employees. Service occupations and Management, business, science, and arts occupations employed 25% and 22% of black residents, respectively; the majority of black female residents work in these occupations (32% and 28%). Service occupations are notable for employing 25% of black employees, but being the only occupational group to have a median hourly wage lower than the living wage, choosing to pay employees the minimum wage (Table 4, Figure 3).
Table 4 - 2018 SEX BY OCCUPATION FOR THE CIVILIAN EMPLOYED POPULATION 16 YEARS AND OVER
(BLACK OR AFRICAN AMERICAN ALONE)
Total:
29,958
Male:
13,694
Production, transportation, and material moving occupations: Service occupations:
Sales and office occupations:
Management, business, science, and arts occupations:
46%
5,487 40% 2,343 17% 2,249 16% 2,133 16%
