
Page 7 - CFGF Racial Disparities Taskforce Development
P. 7
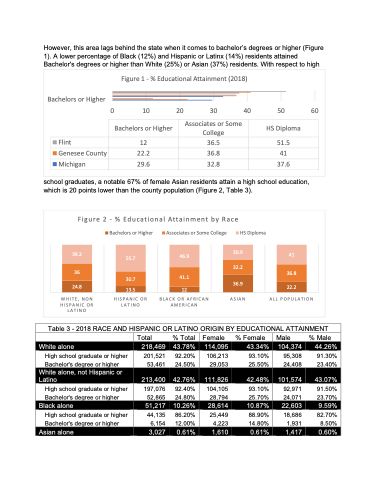
However, this area lags behind the state when it comes to bachelor’s degrees or higher (Figure 1). A lower percentage of Black (12%) and Hispanic or Latinx (14%) residents attained Bachelor's degrees or higher than White (25%) or Asian (37%) residents. With respect to high
        Bachelors or Higher
Figure 1 - % Educational Attainment (2018)
0 10 20 30 40 50 60
 Associates or Some College
    Flint
Bachelors or Higher
HS Diploma
     Genesee County
12
36.5
51.5
     22.2
36.8
41
     Michigan
29.6
32.8
37.6
    school graduates, a notable 67% of female Asian residents attain a high school education, which is 20 points lower than the county population (Figure 2, Table 3).
  Figure 2 - % Educational Attainment by Race
Bachelors or Higher
WHITE, NON HISPANIC OR HISPANIC OR LATINO
LATINO
Associates or Some College HS Diploma
BLACK OR AFRICAN ASIAN ALL POPULATION AMERICAN
       39.2
36
24.8
55.7
30.7
13.5
46.9
41.1
12
30.9
32.2
36.9
41
36.8
22.2
    Table 3 - 2018 RACE AND HISPANIC OR LATINO ORIGIN BY EDUCATIONAL ATTAINMENT
         White alone
   218,469 43.78%
   114,095 43.34%
   104,374 44.26%
High school graduate or higher Bachelor's degree or higher
High school graduate or higher Bachelor's degree or higher
High school graduate or higher Bachelor's degree or higher
Total % Total Female
201,521 92.20% 106,213 53,461 24.50% 29,053
197,076 92.40% 104,105 52,865 24.80% 28,794
44,135 86.20% 25,449 6,154 12.00% 4,223
% Female
93.10% 25.50%
93.10% 25.70%
88.90% 14.80%
Male % Male
95,308 91.30% 24,408 23.40%
92,971 91.50% 24,071 23.70%
18,686 82.70% 1,931 8.50%
White alone, not Hispanic or
           Latino
213,400 42.76%
111,826 42.48%
101,574 43.07%
  Black alone
   51,217 10.26%
   28,614 10.87%
   22,603 9.59%
  Asian alone
   3,027 0.61%
   1,610 0.61%
   1,417 0.60%
