
Page 54 - May-June 2018 GSE Report Flip Book
P. 54
FEDERAL HOME LOAN BANK MAJAYN-UAJRUYNE20210818
In the first quarter of 2018, the FHLB System reported $858 million, an increase of $46 million— or 5.7%—compared to the same period last year. The System’s increased profitability resulted from an increase in net interest income and a decrease in non-interest expense, partially offset by lower gains on derivatives and hedging activities and no gains on litigation settlements.
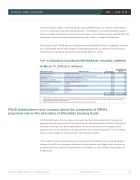
The System’s top 10 FHLB advance holding borrowers held $265.6 billion in aggregate on March
31st, representing 38.0% of the System’s outstanding advances. (Combined Financial Report,
Federal Home Loan Banks, Quarterly Period Ended March 31, 2018)
Table 7 presents the FHLBanks' top 10 advance holding borrowers at the holding-company level on a combined basis based on the principal amount of advances outstanding at March 31, 2018. The percentage of total advances for each holding company was computed by dividing the principal amount of advances by subsidiaries of that holding company by the principal amount of total combined advances. These percentage concentrations do not represent borrowing concentrations in an individual FHLBank.
TOP 10 ADVANCE HOLDING BORROWERS BY HOLDING COMPANY
Table 7 - Top 10 Advance Holding Borrowers by Holding Company at March 31, 2018
At March 31, 2018 ($ in millions)
(dollars in millions)
Percentage of Total
Principal Amount of Holding Company Name(1) FHLBank Districts(2) Principal Amount Advances
Wells Fargo & Company Des Moines, San Francisco $ 58,829 8.4%
JPMorgan Chase & Co.
Citigroup Inc. New York, Dallas, San Francisco 30,996 4.4%
Pittsburgh, Cincinnati, Chicago, Des Moines, San Francisco
56,833 8.1%
Bank of America Corporation
The PNC Financial Services Group, Inc. Pittsburgh, Atlanta, Cincinnati 19,537 2.8%
Boston, Atlanta, Des Moines, San Francisco
29,140 4.2%
Ally Financial Inc.
MetLife, Inc. Boston, New York, Pittsburgh, Des Moines 16,670 2.4%
New York Community Bancorp, Inc.
Mitsubishi UFJ Financial Group, Inc. San Francisco 11,900 1.7%
Navy Federal Credit Union
____________________
(1) Holding company information was obtained from the Federal Reserve System's web site, the National Information Center (NIC), and SEC filings. The NIC is a central repository of data about banks and other institutions for which the Federal Reserve System has a supervisory, regulatory, or research interest, including both domestic and foreign banking organizations operating in the United States.
(2) At March 31, 2018, each holding company had subsidiaries with advance borrowings in these FHLBank districts.
Pittsburgh
18,550 2.7%
New York Atlanta
12,535 1.8% 10,629 1.5%
$ 265,619
38.0%
Investments
FHLB stakeholders voice concern about the complexity of FHFA’s
The FHLBanks maintain investment portfolios for liquidity purposes and to generate additional earnings. The income from
these investment portfolios bolsters the FHLBanks' capacity to meet their commitments to affordable housing and community proposed rule on theinavesltlmoenct. TahetiFHoLBnankos infveast finfinoverstdmeantb-qulaelityhsecouruities tionmigtigafteucrnedidt risk inherent in these portfolios. FHFA
regulations prohibit the FHLBanks from investing in certain types of securities and limit the FHLBanks' investment in mortgage-
backed securities (MBS) and asset-backed securities (ABS). (See Risk Management - Credit Risk - Investments for additional
affordable housing funds. Many stakeholders voiced concern about the complexity of the
information.) Figure 8 presents total investments for the most recent five quarters.
The Federal Housing Finance Agency received more than 404 comments on the agency’s proposed rule that would provide the Federal Home Loan Bank System flexibility in allocating
$308.6 $312.5 $318.3 $307.3 v o i c e d $ c3 0o0 n c e r n a b o u t t h e r e s t r i c t i v e n e s s o f t h e p r o p o s a l , w r i t i n g :
$ 1 8 7 . 4 30.3%
40%
30%
20%
$186.0 $186.4 $183.7 $183.8 $200 30.1% 28.9% 29.0% 27.8%
Figure 8: Total Investments
$400 50%
p r o p o s e d r u l e , w h i c h r e s u l t e d i n a 3 0 - d a y e x t e n s i o n o n t h e c o m m e n t p e r i o$ 3d2 9 t. 4o J u n e 1 2 . M a n y
“The [rule’s] outcomes-based framework around which the proposed rule is built significantly
$100
changes the AHP$1f2r2o.6m a progra$m126.t1hat rewards$13t4h.6ose projec$t1s23m.5 ost aligne$d14w2.0ith priorities in a
10% scoring f$r0amework,” wrote the Federal Home Loan Banks in a June 1st letter. Specifi0c%ally, the
FHLBs wrote: March 31, 2017 June 30, 2017 September 30, 2017 December 31, 2017 March 31, 2018
Interest-bearing Deposits, Securities Purchased Under Agreements to Resell, and Federal Funds Sold Investment Securities
Total Investments as a Percentage of Total Assets
© 2018 by Canfield Press, LLC. All rights reserved. www.canfieldpress.com 54
12
dollars in billions
percentage
