
Page 65 - May-June 2018 GSE Report Flip Book
P. 65
FARM CREDIT SYSTEM / FARMER MAC MAJAYN-UAJRUYNE20210818
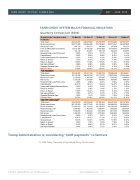
FARM CREDIT SYSTEM MAJOR FINANCIAL INDICATORS
Farm Credit System Major Financial Indicators, Quarterly Comparison
Quarterly Comparison ($000)
Dollars in Thousands
At and for the 3 months ended
31-Mar-18
31-Dec-17 30-Sep-17 30-Jun-17
31-Mar-17
FCS Banks1
T otal Assets
Gross Loan Volume
Nonaccrual Loans
Cash and Marketable Investments
Net Income
Nonperforming Loans/Total Loans2
Capital/Assets3 6.38%
289,079,600 228,084,765 324,571 59,146,365 664,871 0.15% 6.44% 0.00% 0.77% 11.62% 0.96% 0.33% 25.55%
281,784,558 221,196,832 346,898 58,536,899 480,188 0.17% 6.68% 0.00% 0.73% 10.83% 0.98% 0.33% 24.45%
281,374,293 220,771,847 305,674 59,134,552 524,302 0.15% 6.60% 0.00% 0.75% 11.41% 0.98% 0.33% 24.12%
281,557,605 220,657,920 262,223 59,532,555 522,053 0.13% 6.47% 0.00% 0.75% 11.69% 0.98% 0.33% 24.02%
Unallocated Retained Earnings/Assets Return on Assets4
Return on Equity4
Net Interest Margin5
Operating Expense Rate6 Efficiency Ratio7
0.00%
0.77% 12.08% 0.96% 0.31% 21.86%
292,050,031 229,770,408 434,739 60,517,256 554,179 0.20%
FCS Associations
T otal Assets
Gross Loan Volume
Nonaccrual Loans
Net Income
Nonperforming Loans/Total Loans2
Capital/Assets3 20.01%
195,817,424 184,638,381 1,344,366 1,270,878 0.88% 19.31% 0.00% 2.06% 10.44% 2.71% 1.41% 32.66%
191,949,736 181,115,751 1,353,345 958,094 0.91% 19.64% 0.00% 1.88% 9.59% 2.72% 1.42% 38.68%
189,686,438 179,574,344 1,362,342 824,482 0.95% 19.47% 0.00% 1.79% 9.18% 2.72% 1.43% 41.32%
188,180,651 178,551,492 1,366,803 849,705 0.97% 19.43% 0.00% 1.83% 9.52% 2.73% 1.45% 41.92%
Unallocated Retained Earnings/Assets Return on Assets4
Return on Equity4
Net Interest Margin5
Operating Expense Rate6 Efficiency Ratio7
0.00%
2.20% 11.09% 2.78% 1.42% 38.78%
193,348,457 183,115,796 1,430,816 1,045,035 0.96%
Total Farm Credit System8
T otal Assets
Gross Loan Volume
Bonds and Notes
Nonperforming Loans
Nonaccrual Loans
Net Income
Nonperforming Loans/Gross Loans2
Capital/Assets3 16.87% Surplus/Assets 13.43%
329,518,000 258,777,000 267,119,000
1,967,000 1,660,000 5,189,000
0.76% 16.81% 13.24%
1.61% 9.48% 2.48%
321,591,000 251,162,000 260,199,000
2,036,000 1,701,000 3,716,000
0.81% 17.26% 13.55%
1.55% 9.12% 2.52%
320,381,000 250,464,000 260,259,000
2,045,000 1,671,000 2,466,000
0.82% 17.02% 13.99%
1.55% 9.21% 2.46%
320,127,000 250,234,000 260,648,000
2,023,000 1,623,000 1,244,000
0.81% 16.69% 13.52%
1.58% 9.44% 2.43%
Return on Assets4 Return on Equity4 Net Interest Margin5
0.85%
1.54% 9.14% 2.44%
333,029,000 261,378,000 270,958,000
2,209,000 1,863,000 1,266,000
Sources: FCA’s Consolidated Reporting System as of March 31, 2018, and the Farm Credit System Quarterly Information Statement provided by the Federal Farm Credit Banks Funding Corporation.
Trump Administration is considering “tariff payments” to farmers
1 Includes Farm Credit Banks and the Agricultural Credit Bank.
2 Nonperforming loans are defined as nonaccrual loans, accruing restructured loans, and accrual loans 90 or more days past due. 3 Capital includes restricted capital (amount in Farm Credit Insurance Fund), excludes mandatorily redeemable preferred stock and
InproUteSctAedTborrdoawyer,cSapeitcalr.etaryofAgricultureSonnyPerduewrote:
4 Rates of return are annualized.
5 Net interest margin ratio measures net income produced by interest-earning assets, including the effect of loanable funds, and is a key indicator of loan pricing effectiveness.
6 Operating expenses divided by average gross loans, annualized.
7 The efficiency ratio measures total noninterest expenses for the preceding 12 months divided by net interest income plus noninterest income for the preceding 12 months.
8 Cannot be derived by adding the above categories because of intradistrict and intra-System eliminations used in Reports to Investors.
© 2018 by Canfield Press, LLC. All rights reserved. www.canfieldpress.com 65
