
Page 30 - January-February-2018_GSE_Report
P. 30
FEDERAL HOME LOAN BANK JJAN.U- AFERBY. 22001188
February 22, 2018
FEDERAL HOME LOAHoNmeBLoAan NBanKksS
FOR IMMEDIATE RELEASE:
Office of Finance Announces Fourth Quarter and Annual 2017 Combined Operating Highlights for the Federal
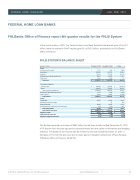
The fourth quarter and annual 2017 highlights are preliminary and prepared from the unaudited financial information of each Federal Home Loan Bank (FHLBank) and are subject to change. The combined and individual FHLBank balance sheet and income statement highlights are attached as Tables I and II. Each of the FHLBanks has
FHLBanks Of ce of Finance report 4th quarter results for the FHLB System
released its unaudited financial results for the periods ended December 31, 2017, and filed a Form 8-K with the
U. S. Securities and Exchange Commission.
Highlights
Net income was $866 million and $3,376 million for the three months and year ended December 31, 2017, decreases
In the fourth quarter of 2017, the Federal Home Loan Bank System’s total assets grew 4% to $1.1
of 5% and 1% compared to the same periods in 2016. Balance sheet highlights as of December 31, 2017, compared
trillion, while the system’s GAAP capital grew 8% to $56.5 billion, according to the FHLBanks
to December 31, 2016 were:
Of ce of Finance.
• Total assets were $1,103.5 billion, an increase of 4%.
• Total liabilities were $1,047.0 billion, an increase of 4%.
• Total GAAP capital was $56.5 billion, an increase of 8%.
Balance Sheet
FHLB SYSTEM’S BALANCE SHEET
(Dollars in millions) December 31, 2017 December 31, 2016 Change
Assets
Cash and due from banks $ 7,175 Investments 307,280 Advances 731,544
$
$
$
7,441 292,017 705,225 48,476 3,553
409,815 578,927 988,742
1,704 13,807
36,234 52 16,330
(157)
1,056,712
4.96%
$
$
$
(266) 15,263 26,319 5,351 72
(18,335) 62,674 44,339
(432) (1,189)
1,423 (52) 1,769
881
46,739
0.16%
Mortgage loans held for portfolio, net Other assets
Total assets
53,827 3,625
$ 1,103,451
$ 1,056,712
$ 46,739
Consolidated obligations
Discount notes
Bonds 641,601
$
$
391,480
Total consolidated obligations Mandatorily redeemable capital stock Other liabilities
Total liabilities Capital
Capital stock
Additional capital from merger
Retained earnings
Accumulated other comprehensive income (loss)
Total capital (GAAP)
Total liabilities and capital Regulatory capital
GAAP capital-to-assets ratio Regulatory capital-to-assets ratio
1,033,081 1,272 12,618
37,657 — 18,099 724
1,103,451
5.12%
1,046,971
1,004,253
42,718
56,480
52,459
4,021
$ 57,027
$ 54,318
$ 2,709
5.17%
5.14%
0.03%
1
The System reported net income of $866 million for the three months ended December 31, 2017, a 5% decline from the year ago period caused primarily by lower gains on derivatives and hedging activities. The System’s net income was $3.4 billion for the year ended December 31, 2017, a decrease of 1% from the prior year due to lower gains on litigation settlements. (Press Release, FHLBanks Of ce of Finance, 02/22/18)
© 2018 by Can eld Press, LLC. All rights reserved. www.can eldpress.com 30
