
Page 64 - September October 2018 Disruption Report Flip Book
P. 64
FARM CREDIT SYSTEM / FARMER MAC
SEJPATN.U-AORCYT.20210818
www.coba
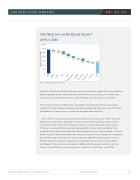
largest impact on reducing the pri commercial PV solar arrays in the Moving forward the total install pri small commercial systems (less th 100 kW) could reach $1.31/Wdc by (See Exhibit 1.)
The Federal ITC and Net Metering Drive Adoption of On-Farm Solar Generation The most important incentive for s the federal Investment Tax Credit ( The tax benefits provided by the IT consumer with a large tax liability enough to incentivize the develop of an on-farm solar facility, regardl
project economics. Project owners are provided a
the Price of Solar Will Fall
Recently, the price of solar modules in the U.S. increased
converges with retail electricity rates, which will likely octhcruorubgyh 201295, iwnhmenosittwsitlladterosp. to 26 percent in 2
THE PRICE OF A 40 kW SOLAR FACILITY
2018 vs. 2030
EXHIBIT 1: The Price of a 40 kW Solar Facility, 2018 vs. 2030
$3.50
$3.00 2.82 $2.50
$2.00
$1.50
$1.00
$.50 $0
-0.10 -0.07
-0.30
-0.28
-0.23 -0.04
-0.33 -0.08
1.31
-0.07
Source: CoBank, Department of Energy
Source: CoBank, Department of Energy
As Sure as the Sun Will Rise,
Adoption of distributed solar among ag producers remains low, largely driven by incentives
credit equal to 30 percent of the installation cost f and tax appetite, but will accelerate when the levelized csolsatr osyfsetenmer.gCyonfogreosns-efaxtremndseodlathre 30 percent c
through the first half of 2018 as a result of import tariffs on solar equipment. However, standard market behavior
22 percent in 2021, and remain at 10 percent fro
2022 onwards. Tamheoncgosmolmaromnapnruafcactitcuereorsf woiflflereridnugcevemryodcuolempproedtiuticvteionretail electricity rates to agricultural
costs and the price of modules. Now that the market
Reduction of the ITC will increase the volatility of p
producers through demand response programs will delay grid parity, but only until 2030 in
has coalesced with more certainty around tariffs, tariff-
pipelines. Demand is likely to surge prior to steppi
the Midwest, and even sooner in areas with stronger solar resources.
included pricing can be predicted with more confidence.1
The solar tariff imposes a 30 percent tax on imported
down to 10 percent, then slow in 2023.
...mTodhueleUs.iSn.yefarmone,cdornoopmpinygis5cpuerrcentlaynantutahlley ubnottiltom of a business cycle, which slows the
reaching 15 percent in 2021. Average module prices
adoption of on-farm solar generation. However, when markets reverse, one thing is for
in the U.S. are currently around $0.45/Wattdc, and are
sure: Solar prices will be lower. Future recoveries in thechoomgp,ednasairtyedabnydthpeoirulotrcyalsuetcilitoyrfsor any excess ge
expected to decline by about 2 percent annually in the
their system produces beyond what they use. See t
of the ag economy will likely signal stronger growth for on-farm solar generation. The
years ahead.
Appendix for a map that includes more information
competition of on-farm solar with retail rates depends heavily on rate structures. Of course,
The installed price for a small commercial solar system
state-level net metering policies.
utilities that don’t offer competitive rates to ag consumers are more exposed to competition
less than 100 kW was around $5/Wattdc in 2012, and
from on-farm solar. However, even low energy rates offeEraecdh tshtaroteu’sgnhept rmoegtrearmings psoulichy daisffers by the rate
which utilities compensate their customers. Some
is currently around $2.80/Wattdc. This translates to an
demand response will begin to experience competition from on-farm solar by 2030 in
energy cost of roughly $0.09-$0.12 per kilowatt-hour
full retail rate, while other utilities pay wholesale r
the Midwest. This will occur even sooner in states with strong solar resources, such as
(kWh), depending on location and other assumptions.
AFarilzlinognab.al(aLnocaedoDf seyfsetecmtio(nBOASm)oangd sAogftricousltsu(rie.eP. roducers, Taylor Gunn, June 2018)
labor, overhead, and marketing) will likely have the
In addition to the ITC, state-level net metering polici critical to growth of distributed solar. States that ad
metering policies provide customers a mechanism
or a rate that reflects a utility’s avoided cost. In ad utilities have different limits on the size of a syste customer can install.
© CoBank ACB, 2018
Prepared by CoBank’s Knowledge Exchange Division • June 2018
nk.com
ce of future.
ce for an
2030.2
olar is ITC). C to a
can be ment
ess of tax
or a redit 020,
m
roject ng
es are opt net
to be neration he
on
at
pay ates,
dition, m each
© 2018 by Canfield Press, LLC. All rights reserved.
www.canfieldpress.com 65
Installation Costs ($2017/Wdc)
2018 Module
Inverter
BOS
Labor Installer Overhead
Permitting
EPC Overhead
Interconnection
Sales Tax
2030
2
