
Page 11 - Dec 2021 Report
P. 11
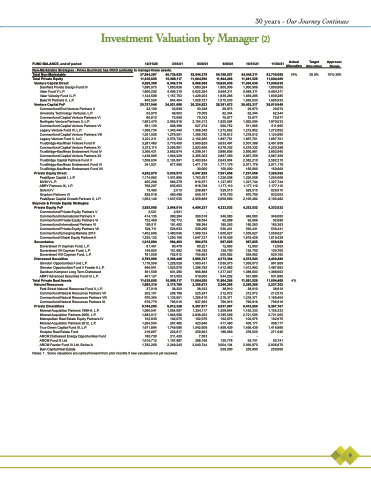
     30 years - Our Journey Continues Investment Valuation by Manager (2)
d
 FUND BALANCE, end of period 12/31/20 3/31/21 Non-Marketable Strategies - Prime Buchholz has OCIO authority to manage these assets.
6/30/21
52,544,279 11,664,550 9,966,568 1,883,284 5,625,354 1,429,203 1,028,727 26,324,823 33,328 70,309 70,152 2,154,213 627,274 1,396,349 1,306,792 2,162,265 3,960,829 3,923,556 4,299,341 2,355,302 2,493,934 1,471,179 30,000 6,947,829 1,753,257 816,971 818,728 258,897 640,107 2,659,869
4,454,237
- 390,518 98,594 188,384 539,290 1,589,724 1,647,727 984,076 80,221 148,192 755,663 3,866,747 1,083,431 1,296,792 966,868 519,655 11,664,550 2,306,673 38,323 225,247 1,205,410 837,693 9,357,877 1,254,117 2,838,252 102,675 423,846 1,542,609 259,963 7,503 288,168 2,640,744
9/30/21
54,198,027 11,804,266 10,820,035
1,800,906 5,664,311 1,839,285 1,515,533
26,381,672
29,973 62,344 75,677
1,925,594 566,752 1,272,852 1,218,612 1,897,761 3,633,497 4,279,332 3,986,806 2,867,359 2,643,934 1,771,179 150,000 7,591,658 1,226,508 1,127,957 1,177,110 529,515 870,700 2,659,869
4,333,532
- 346,083 92,699 185,263 530,431 1,559,627 1,619,429 697,825 12,063 126,700 559,062 4,373,304 1,039,073 1,412,983 1,377,047 544,202 11,804,266 2,266,269 38,910 212,072 1,218,371 796,916 9,537,997 1,209,944 2,785,599 102,675 417,490 1,458,439 188,969 - 120,778 3,004,104 250,000
10/31/21
54,044,211 11,681,529 11,000,035
1,800,906 5,664,311 1,839,285 1,695,533
26,403,217
29,973 62,344 75,677
1,925,594 511,965 1,272,852 1,218,612 1,897,761 3,507,398 4,279,332 3,950,961 2,867,359 2,582,210 2,071,179 150,000 7,237,058 1,226,508 1,327,744 1,177,110 529,515 870,700 2,105,482
4,333,532
- 346,083 92,699 185,263 530,431 1,559,627 1,619,429 697,825 12,063 126,700 559,062 4,372,543 1,039,073 1,412,983 1,388,603 531,885 11,681,529 2,266,269 38,910 212,072 1,218,371 796,916 9,415,260 1,165,333 2,721,505 102,675 408,177 1,458,439 278,520 - 93,741 2,936,870 250,000
11/30/21
53,730,085 11,604,409 11,000,035
1,800,906 5,664,311 1,839,285 1,695,533
26,010,949
29,973 62,344 75,677
1,879,533 511,965 1,272,852 1,124,995 1,897,761 3,461,858 4,220,298 3,802,945 2,867,359 2,582,210 2,071,179 150,000 7,326,362 1,254,508 1,327,744 1,177,110 529,515 932,003 2,105,482
4,333,532
- 346,083 92,699 185,263 530,431 1,559,627 1,619,429 658,928 12,063 126,700 520,165 4,400,280 991,809 1,487,983 1,388,603 531,885
Actual Target Allocation Allocation
19% 20.0%
Approve Range
10%-30%
Total Non-Marketable Total Private Equity
Venture Capital Direct
Deerfield Private Design Fund IV Valar Fund V L.P.
Valar Velocity Fund I L.P. Base10 Partners II, L.P.
Venture Capital FoF
Commonfund End Venture Partners V University Technology Ventures, L.P. Commonfund Capital Venture Partners VI Northgate Venture Partners II, L.P. Commonfund Capital Venture Partners VII Legacy Venture Fund IV, L.P. Commonfund Capital Venture Partners VIII Legacy Venture Fund V, LLC TrueBridge-Kauffman Fellows Fund III Commonfund Capital Venture Partners XI TrueBridge-Kauffman Endowment Fund IV Commonfund Capital Venture Partners XII TrueBridge Capital Partners Fund V TrueBridge-Kauffman Endowment Fund VI TrueBridge-Kauffman Endowment Fund VII
Private Equity Direct
PeakSpan Capital I, L.P. MVM V L.P.
ABRY Partners IX, L.P. Serent IV
Gryphon Partners VI
PeakSpan Capital Growth Partners II, L.P.
Buyouts & Private Equity Strategies Private Equity FoF
Commonfund Private Equity Partners V Commonfund International Partners V Commonfund Private Equity Partners VI Commonfund International Partners VI Commonfund Private Equity Partners VII Commonfund Emerging Markets 2013 Commonfund Global Equity Partners II
Secondaries
Doverstreet VI Cayman Fund, L.P. Doverstreet VII Cayman Fund, L.P. Doverstreet VIII Cayman Fund, L.P.
Distressed Securities
Glendon Opportunities Fund L.P.
Glendon Opportunities Fund II Feeder A L.P. Davidson Kempner Long Term Distressed ABRY Advanced Securities Fund IV, L.P.
Total Private Real Assets Natural Resources
Park Street Natural Resources Fund II, L.P. Commonfund Natural Resources Partners VII Commonfund Natural Resources Partners VIII Commonfund Natural Resources Partners IX
Private Diversifiers
Mineral Acquisition Partners 1999-A, L.P. Mineral Acquisition Partners 2000, L.P. Metropolitan Real Estate Equity Partners IV Mineral Acquisition Partners 2012, L.P. True Green Capital Fund III, L.P.
Sculptor Real Estate Fund
ARCM Distressed Energy Opportunities Fund ARCM Fund III Ltd.
ARCM Feeder Fund IV Ltd, Series A
Bain Capital Real Estate
37,994,287 11,635,605 5,260,309 1,690,075 1,600,202 1,124,508 845,524 20,757,944 32,100 63,970 80,812 1,853,470 581,133 1,398,734 1,261,926 2,221,211 3,287,483 3,272,114 3,366,431 1,438,905 1,558,634 341,021
4,242,979
1,174,862 405,268 768,207
15,483 826,018 1,053,140
3,925,085
2,521 414,135 152,469 193,511 524,711 1,402,606 1,235,132 1,012,884 81,401 149,924 781,559 2,795,086 1,119,509 846,941 361,509 467,127 11,635,605 1,889,310 37,019 202,151 970,364 679,776 9,746,295 1,080,541 1,882,917 103,830 1,204,554 1,671,894 219,857 180,730 1,619,712 1,782,260
45,739,920 10,988,117 8,349,314 1,850,838 4,496,319 1,157,703 844,454 24,021,688 32,839 69,063 73,509 2,065,916 608,398 1,345,440 1,279,591 2,576,732 3,779,450 3,595,991 3,852,874 1,940,229 2,124,061 677,595
5,033,973
1,431,895 666,378 835,653
2,013 460,498 1,637,535
3,944,014
2,521 390,284 102,772 191,402 526,833 1,480,046 1,250,156 994,483 80,479 151,992 762,012 3,396,448 1,228,529 1,023,076 631,290 513,553 10,988,117 2,175,789 38,323 208,799 1,133,651 795,016 8,812,328 1,054,007 1,846,586 102,675 267,485 1,749,099 223,817 211,429 1,107,987 2,249,243
11,604,409 4% 2,237,302
38,910 212,072 1,189,404 796,916 9,367,107 1,165,333 2,721,505 102,675 408,177 1,416,866 271,940 - 93,741 2,936,870 250,000
Notes: 1. Some valuations are carried forward from prior months if new valuations not yet received.
 9
