
Page 12 - Robo Advisors and Growing Your Wealth
P. 12
Very Few Actively-
Very Few Actively- 97.85%
2.33%
2.33%
Managed Funds
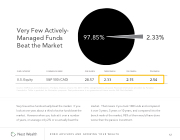
Managed Funds Beat the Market
Beat the Market
97.85%
FUND CATEGORY FUND CATEGORY
U.S. Equity
U.S. Equity
COMPARISON INDEX ONE-YEAR(%) THREE-YEAR(%) COMPARISON INDEX ONE-YEAR(%)
S&P 500 (CAD) 28.57
S&P 500 (CAD) 28.57 2.33
FIVE-YEAR(%)
2.15
TEN-YEAR(%)
2.54
Source: S&P Dow JonesIndicesLLC, Fundata. Data as of June 30, 2017. CIFSC categorizations are used. Financial information provided by Fundata Canada Inc. Table is provided for illustrative purposes. Past performance is no guarantee of future results. NA: Not Available.
Source: S&P Dow JonesIndicesLLC, Fundata. Data as of June 30, 2017. CIFSC categorizations are used. Financial information provided by Fundata Canada Inc. Table is provided for illustrative purposes. Past performance is no guarantee of future results. NA: Not Available.
THREE-YEAR(%) FIVE-YEAR(%) TEN-YEAR(%)
2.33 2.15 2.54
Very few active funds actually beat the market. If you look at one year, about a third of active funds beat the market. However when you look at it over a number of years, on average only 2% or so actually beat the
market. ThaRt moebaons-Aif ydovuitsookrs10a0nfdunIdnsvaendstcionmgp1ar0ed1 / January Robo-Advisors and Investing 101 / January 16th
it over 3 years, 5 years or 10 years, and compared it to the bench mark of the market, 98% of them would have done worse than the passive investment.
ROBO ADVISORS AND GROWING YOUR WEALTH
12
1
