
Page 50 - UGU Dstrct Mun IDP Report '21-22
P. 50
• An increase in heat stress, leading to dehydration, particularly for those that reside in the urban areas, as well as children and the elderly;
• Changes in the geographical distribution of plants and animals with extinction of species that are unable to move and an increase in the prevalence of alien invasive species. This will negatively affect the biodiversity of the Ugu area of jurisdiction and the associated goods and services;
• Further loss of critically endangered grassland habitats as they are outcompeted by woody species able to utilize the higher concentrations of CO2 in the atmosphere.
• A reduction in yield of staple food crops, such as maize;
• Changes in the optimal planting and harvesting dates for crops as well as land suitable for crop production;
• Heat stress increasing livestock and poultry mortality rates;
• An increase in respiratory problems in the city due to a decrease in air quality (e.g. changes in the concentration and
distribution of near-surface ozone) and increased dampness; and
• Deterioration of foods leading to increased incidents of food-borne diseases.
The likely climate change impacts have been assessed and plans, programmes and projects have been developed to assist the Ugu District in dealing with these impacts. The mitigation and adaptation work streams of the MCPP are in the Energy Office and the Environmental Planning and Climate Protection Department respectively.
3.2.8 Solid Waste
Waste management services involve the waste collection, treatment, recycling and disposal. The National Environmental Management: Waste Act (Act 59 of 2008) has placed a huge responsibility on municipalities to deliver waste services. Where services are being offered, they are usually limited to the formal, urban areas of Umuziwabantu, Ray Nkonyeni and Umdoni Municipalities. Waste minimisation in the district is poorly organised and there is no integrated system which exists that private recyclers may link to. This excludes some parts of Ray Nkonyeni Municipality that have organised waste minimization activities, education, private partnership and so on. However, it must be noted that the viability of recycling relies heavily on economies of scale as there must be enough recyclables available to justify the cost of transport associated with the collection of recyclable materials. Ugu requires a great deal more work before an economically viable waste recycling system can be put in place.
There should be a designated site for recycling purposes in all LMs. The norm has always been that majority of the population buries or burns their waste in their own backyard. The recent tendency is the disposal of waste, especially disposable nappies, in water bodies (streams). This has environmental, health and safety implications for the community of Ugu especially that communities still depend on streams of water for household consumption. The interventions by the stakeholders – national departments, district and local municipalities must be strategic in nature. It needs to consider peripheral but deeply seated issues like population growth, consumption culture, products that the population is able to afford due to some improvements in livelihoods resulting to lifestyle changes and therefore changing waste streams. The next generation of strategies and waste management plans should consider these aspects.
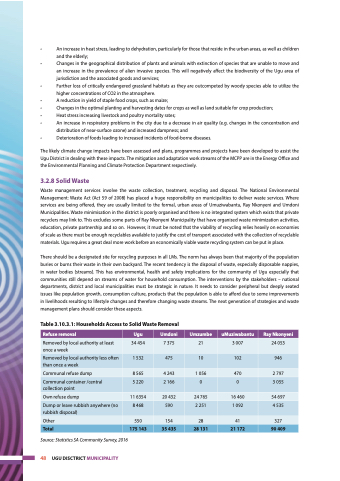
Table 3.10.3.1: Households Access to Solid Waste Removal
Refuse removal
Ugu
Umdoni
Umzumbe
uMuziwabantu
Ray Nkonyeni
Removed by local authority at least once a week
34 454
7 375
21
3 007
24 053
Removed by local authority less often than once a week
1 532
475
10
102
946
Communal refuse dump
8 565
4 243
1 056
470
2 797
Communal container /central collection point
5 220
2 166
0
0
3 055
Own refuse dump
11 6354
20 432
24 765
16 460
54 697
Dump or leave rubbish anywhere (no rubbish disposal)
8 468
590
2 251
1 092
4 535
Other
550
154
28
41
327
Total
175 143
35 435
28 131
21 172
90 409
Source: Statistics SA Community Survey, 2016
48 UGU DISCTRICT MUNICIPALITY
