
Page 96 - UGU Dstrct Mun IDP Report '21-22
P. 96
3.5.5 Access to Water Services
The Census 2016 Community Survey with regards to access to piped water released data in the following categories:
• Piped (tap) water inside the dwelling /house;
• Piped (tap) water inside yard;
• Piped water on community stand;
• Borehole in the yard;
• Rain-water tank in yard;
• Neighbours tap;
• Public/ communal tap;
• Water-carrier /tanker;
• Borehole outside the yard;
• Flowing water/ stream /river;
• Well; and
• Spring.
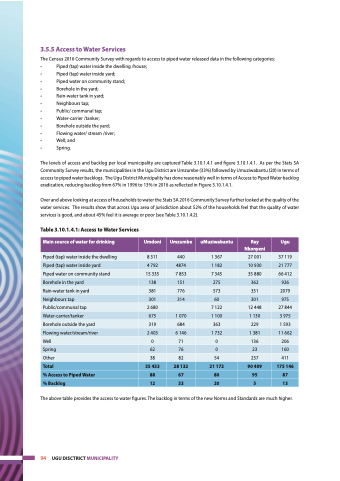
The levels of access and backlog per local municipality are captured Table 3.10.1.4.1 and figure 3.10.1.4.1. As per the Stats SA Community Survey results, the municipalities in the Ugu District are Umzumbe (33%) followed by Umuziwabantu (20) in terms of access to piped water backlogs. The Ugu District Municipality has done reasonably well in terms of Access to Piped Water backlog eradication, reducing backlog from 67% in 1996 to 13% in 2016 as reflected in Figure 3.10.1.4.1.
Over and above looking at access of households to water the Stats SA 2016 Community Survey further looked at the quality of the water services. The results show that across Ugu area of jurisdiction about 52% of the households feel that the quality of water services is good, and about 45% feel it is average or poor (see Table 3.10.1.4.2).
Table 3.10.1.4.1: Access to Water Services
Main source of water for drinking
Umdoni
Umzumbe
uMuziwabantu
Ray Nkonyeni
Ugu
Piped (tap) water inside the dwelling
8 311
440
1 367
27 001
37 119
Piped (tap) water inside yard
4 792
4874
1 182
10 930
21 777
Piped water on community stand
15 335
7 853
7 345
35 880
66 412
Borehole in the yard
138
151
275
362
926
Rain-water tank in yard
381
776
573
351
2079
Neighbours tap
301
314
60
301
975
Public/communal tap
2 680
7 122
12 448
27 844
Water-carrier/tanker
675
1 070
1 100
1 130
3 975
Borehole outside the yard
319
684
363
229
1 593
Flowing water/stream/river
2 403
6 146
1 732
1 381
11 662
Well
0
71
0
136
206
Spring
62
76
0
23
160
Other
38
82
54
237
411
Total
35 433
28 132
21 172
90 409
175 146
% Access to Piped Water
88
67
80
95
87
% Backlog
12
33
20
5
13
The above table provides the access to water figures. The backlog in terms of the new Norms and Standards are much higher.
94 UGU DISCTRICT MUNICIPALITY
