
Page 53 - Parliament Budget Office Annual Report 2022-2023
P. 53
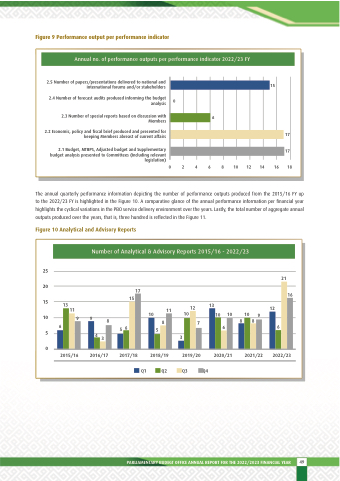
  Figure 9 Performance output per performance indicator
  Annual no. of performance outputs per performance indicator 2022/23 FY
          2.5 Number of papers/presentations delivered to national and international forums and/or stakeholders
2.4 Number of forecast audits produced informing the budget analysis
2.3 Number of special reports based on discussion with Members
2.2 Economic, policy and fiscal brief produced and presented for keeping Members abreast of current affairs
2.1 Budget, MTBPS, Adjusted budget and Supplementary budget analysis presented to Committees (Including relevant legislation)
15
17
17 0 2 4 6 8 10 12 14 16 18
 0
 6
   The annual quarterly performance information depicting the number of performance outputs produced from the 2015/16 FY up to the 2022/23 FY is highlighted in the Figure 10. A comparative glance of the annual performance information per financial year highlights the cyclical variations in the PBO service delivery environment over the years. Lastly, the total number of aggregate annual outputs produced over the years, that is, three hundred is reflected in the Figure 11.
Figure 10 Analytical and Advisory Reports
  25
20
15
10
6
5 0
Number of Analytical & Advisory Reports 2015/16 - 2022/23
17 15
8
56
   13
11
99
21 16
2021/22 2022/23
     11 12 13
10 10 101010
12 9
           8 5
              3
7
6
8
8
6
   43 2015/16 2016/17
2017/18 2018/19
Q1 Q2 Q3 Q4
  2019/20 2020/21
       PARLIAMENTARY BUDEGT OFFICE ANNUAL REPORT FOR THE 2022/2023 FINANCIAL YEAR
4499
