
Page 102 - UKZN Proceedings of the Conference Report
P. 102
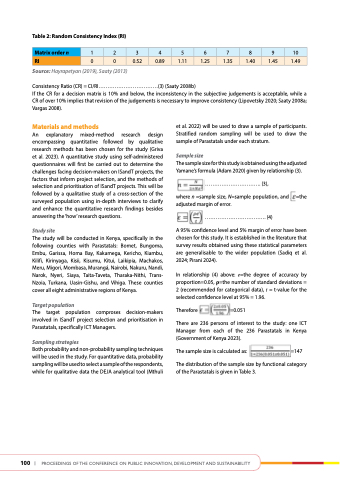
table 2: random Consistency Index (rI)
  Matrix order n
 1
 2
 3
 4
 5
 6
 7
 8
 9
 10
  rI
  0
  0
  0.52
  0.89
  1.11
  1.25
  1.35
  1.40
  1.45
  1.49
   Source: Hayrapetyan (2019), Saaty (2013)
Consistency Ratio (CR) = CI/RI.................................(3) (Saaty 2008b)
If the CR for a decision matrix is 10% and below, the inconsistency in the subjective judgements is acceptable, while a CR of over 10% implies that revision of the judgements is necessary to improve consistency (Lipovetsky 2020; Saaty 2008a; Vargas 2008).
Materials and methods
An explanatory mixed-method research design encompassing quantitative followed by qualitative research methods has been chosen for the study (Griva et al. 2023). A quantitative study using self-administered questionnaires will first be carried out to determine the challenges facing decision-makers on ISandT projects, the factors that inform project selection, and the methods of selection and prioritisation of ISandT projects. This will be followed by a qualitative study of a cross-section of the surveyed population using in-depth interviews to clarify and enhance the quantitative research findings besides answering the ‘how’ research questions.
Study site
The study will be conducted in Kenya, specifically in the following counties with Parastatals: Bomet, Bungoma, Embu, Garissa, Homa Bay, Kakamega, Kericho, Kiambu, Kilifi, Kirinyaga, Kisii, Kisumu, Kitui, Laikipia, Machakos, Meru, Migori, Mombasa, Murangá, Nairobi, Nakuru, Nandi, Narok, Nyeri, Siaya, Taita-Taveta, Tharaka-Nithi, Trans- Nzoia, Turkana, Uasin-Gishu, and Vihiga. These counties cover all eight administrative regions of Kenya.
Target population
The target population comproses decision-makers involved in ISandT project selection and prioritisation in Parastatals, specifically ICT Managers.
Sampling strategies
Both probability and non-probability sampling techniques will be used in the study. For quantitative data, probability sampling will be used to select a sample of the respondents, while for qualitative data the DEJA analytical tool (Mthuli
et al. 2022) will be used to draw a sample of participants. Stratified random sampling will be used to draw the sample of Parastatals under each stratum.
Sample size
The sample size for this study is obtained using the adjusted Yamane’s formula (Adam 2020) given by relationship (3).
............................... (3),
where n =sample size, N=sample population, and   =the adjusted margin of error.
.................................. (4)
A 95% confidence level and 5% margin of error have been chosen for this study. It is established in the literature that survey results obtained using these statistical parameters are generalisable to the wider population (Sadiq et al. 2024; Pirani 2024).
In relationship (4) above: e=the degree of accuracy by proportion=0.05, 𝛒=the number of standard deviations = 2 (recommended for categorical data), t = t-value for the selected confidence level at 95% = 1.96.
Therefore   =0.051
There are 236 persons of interest to the study: one ICT Manager from each of the 236 Parastatals in Kenya (Government of Kenya 2023).
The sample size is calculated as: =147
The distribution of the sample size by functional category of the Parastatals is given in Table 3.
    100
| Proceedings of the conference on Public innovation, develoPment and sustainability
