
Page 23 - State of Biodiversity 2019-2020
P. 23
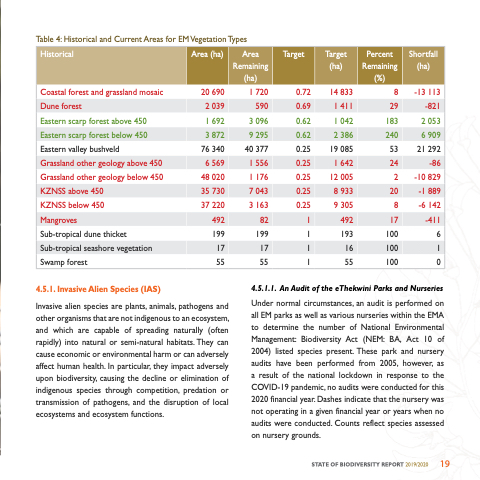
 Table 4: Historical and Current Areas for EM Vegetation Types
 Historical
   Area (ha)
 Area Remaining (ha)
  Target
   Target (ha)
 Percent Remaining (%)
 Shortfall (ha)
 Coastal forest and grassland mosaic 20 690
1 720 0.72 14 833 8 -13 113
 Dune forest
 2 039
 590
 0.69
 1 411
 29
 -821
 Eastern scarp forest above 450
  1 692
  3 096
  0.62
  1 042
  183
  2 053
 Eastern scarp forest below 450
3 872
9 295
0.62
2 386
240
6 909
 Eastern valley bushveld
  76 340
  40 377
  0.25
  19 085
  53
  21 292
 Grassland other geology above 450
6 569
1 556
0.25
1 642
24
-86
 Grassland other geology below 450
 48 020
 1 176
 0.25
 12 005
 2
 -10 829
 KZNSS above 450
  35 730
  7 043
  0.25
  8 933
  20
  -1 889
 KZNSS below 450
37 220
3 163
0.25
9 305
8
-6 142
 Mangroves
  492
  82
  1
  492
  17
  -411
 Sub-tropical dune thicket
199
199
1
193
100
6
 Sub-tropical seashore vegetation
  17
  17
  1
  16
  100
  1
 Swamp forest
 55
 55
 1
 55
 100
 0
   4.5.1. Invasive Alien Species (IAS)
Invasive alien species are plants, animals, pathogens and other organisms that are not indigenous to an ecosystem, and which are capable of spreading naturally (often rapidly) into natural or semi-natural habitats. They can cause economic or environmental harm or can adversely affect human health. In particular, they impact adversely upon biodiversity, causing the decline or elimination of indigenous species through competition, predation or transmission of pathogens, and the disruption of local ecosystems and ecosystem functions.
4.5.1.1. An Audit of the eThekwini Parks and Nurseries
Under normal circumstances, an audit is performed on all EM parks as well as various nurseries within the EMA to determine the number of National Environmental Management: Biodiversity Act (NEM: BA, Act 10 of 2004) listed species present. These park and nursery audits have been performed from 2005, however, as a result of the national lockdown in response to the COVID-19 pandemic, no audits were conducted for this 2020 financial year. Dashes indicate that the nursery was not operating in a given financial year or years when no audits were conducted. Counts reflect species assessed on nursery grounds.
STATE OF BIODIVERSITY REPORT 2019/2020 19
