
Page 34 - State of Biodiversity 2019-2020
P. 34
4.6. Responses toThreats
4.6.1. Greenhouse Gas Emissions Inventory
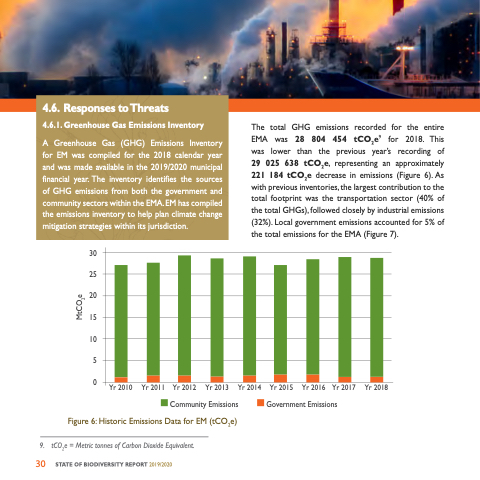
A Greenhouse Gas (GHG) Emissions Inventory for EM was compiled for the 2018 calendar year and was made available in the 2019/2020 municipal financial year. The inventory identifies the sources of GHG emissions from both the government and community sectors within the EMA. EM has compiled the emissions inventory to help plan climate change mitigation strategies within its jurisdiction.
The total GHG emissions recorded for the entire EMA was 28 804 454 tCO2e9 for 2018. This was lower than the previous year’s recording of 29 025 638 tCO2e, representing an approximately 221 184 tCO2e decrease in emissions (Figure 6). As with previous inventories, the largest contribution to the total footprint was the transportation sector (40% of the total GHGs), followed closely by industrial emissions (32%). Local government emissions accounted for 5% of the total emissions for the EMA (Figure 7).
30 25 20 15 10
5 0
Yr 2010
Yr 2011
Yr 2012
Community Emissions
Yr 2013
Yr 2014
Yr 2015
Government Emissions
Yr 2018
Yr 2016
Yr 2017
9.
Figure 6: Historic Emissions Data for EM (tCO2e)
tCO2e = Metric tonnes of Carbon Dioxide Equivalent.
30
STATE OF BIODIVERSITY REPORT 2019/2020
MtCO2e
