
Page 37 - State of Biodiversity 2019-2020
P. 37
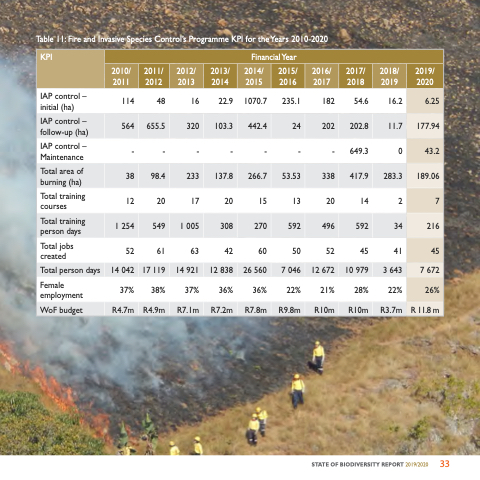
 Table 11: Fire and Invasive Species Control’s Programme KPI for the Years 2010-2020
  KPI
  Financial Year
 2010/ 2011
  2011/ 2012
  2012/ 2013
  2013/ 2014
  2014/ 2015
  2015/ 2016
  2016/ 2017
  2017/ 2018
   2018/ 2019
   2019/ 2020
   IAP control – initial (ha)
 114
  48
16
  22.9
1070.7
  235.1
182
  54.6
 16.2
 6.25
  IAP control – follow-up (ha)
  564
  655.5
  320
  103.3
  442.4
  24
  202
  202.8
   11.7
   177.94
  IAP control – Maintenance
 -
  -
-
  -
-
  -
-
  649.3
 0
 43.2
  Total area of burning (ha)
 38
 98.4
 233
 137.8
 266.7
 53.53
 338
 417.9
  283.3
  189.06
  Total training courses
  12
  20
  17
  20
  15
  13
  20
  14
   2
   7
  Total training person days
 1 254
  549
1 005
  308
270
  592
496
  592
 34
 216
  Total jobs created
 52
 61
 63
 42
 60
 50
 52
 45
  41
  45
 Total person days
  14 042
  17 119
  14 921
  12 838
  26 560
  7 046
  12 672
  10 979
  3 643
  7 672
  Female employment
 37%
  38%
37%
  36%
36%
  22%
21%
  28%
 22%
 26%
 WoF budget
  R4.7m
  R4.9m
  R7.1m
  R7.2m
  R7.8m
  R9.8m
  R10m
  R10m
  R3.7m
  R 11.8 m
       STATE OF BIODIVERSITY REPORT 2019/2020 33
