
Page 22 - State of Biodiversity 2018/19
P. 22
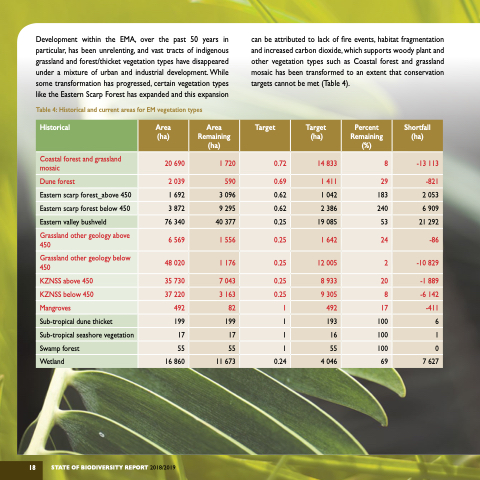
 Development within the EMA, over the past 50 years in particular, has been unrelenting, and vast tracts of indigenous grassland and forest/thicket vegetation types have disappeared under a mixture of urban and industrial development. While some transformation has progressed, certain vegetation types like the Eastern Scarp Forest has expanded and this expansion
Table 4: Historical and current areas for EM vegetation types
can be attributed to lack of fire events, habitat fragmentation and increased carbon dioxide, which supports woody plant and other vegetation types such as Coastal forest and grassland mosaic has been transformed to an extent that conservation targets cannot be met (Table 4).
 Historical
 Area (ha)
  Area Remaining (ha)
 Target
 Target (ha)
Percent Remaining (%)
 Shortfall (ha)
 Coastal forest and grassland mosaic
 20 690
 1 720
 0.72
 14 833
 8
 -13 113
 Dune forest
 2 039
 590
 0.69
 1 411
 29
 -821
 Eastern scarp forest_above 450
  1 692
  3 096
  0.62
  1 042
  183
  2 053
 Eastern scarp forest below 450
3 872
9 295
0.62
2 386
240
6 909
 Eastern valley bushveld
  76 340
  40 377
  0.25
  19 085
  53
  21 292
 Grassland other geology above 450
 6 569
 1 556
 0.25
 1 642
 24
 -86
 Grassland other geology below 450
48 020
1 176
0.25
12 005
2
-10 829
 KZNSS above 450
  35 730
  7 043
  0.25
  8 933
  20
  -1 889
 KZNSS below 450
37 220
3 163
0.25
9 305
8
-6 142
 Mangroves
  492
  82
  1
  492
  17
  -411
 Sub-tropical dune thicket
199
199
1
193
100
6
 Sub-tropical seashore vegetation
 17
 17
 1
 16
 100
 1
 Swamp forest
 55
 55
 1
 55
 100
 0
 Wetland
 16 860
 11 673
 0.24
 4 046
 69
 7 627
    STATE OF BIODIVERSITY REPORT 2018/2019
 18
