
Page 29 - State of Biodiversity 2018/19
P. 29
30 25 20 15 10
5 0
Year 2010
Year 2011
Year 2012 Community Emissions
Year 2014
Government Emissions
Year 2016
Year 2017
Year 2013
Year 2015
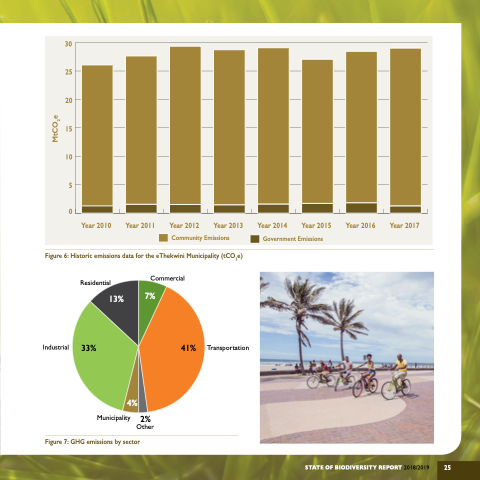
Figure 6: Historic emissions data for the eThekwini Municipality (tCO2e)
Residential
13%
Commercial
7%
Industrial 33%
41% Transportation
Figure 7: GHG emissions by sector
4%
Municipality 2% Other
STATE OF BIODIVERSITY REPORT 2018/2019
25
MtCO2e
