
Page 19 - CSERI Annual Review Report 2023/2024
P. 19
DURBAN UNIVERSITY OF TECHNOLOGY
CSERI PROGRESS REPORT 2023/2024
ANNUAL REPORT 2023/2024 17
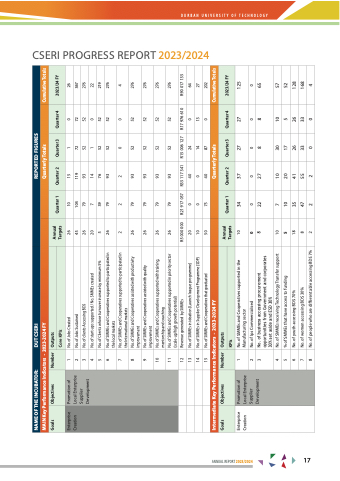
NAME OF THE INCUBATOR:
MAIN Key Performance Indicators -
DUT CSERI 2023-2024 FY
REPORTED FIGURES
Quarterly Totals Cumulative Totals
Goals
Objectives
Number
Outputs
Annual Targets
Quarter 1
Quarter 2 Quarter 3 Quarter 4 2023/24 FY
Enterprise Creation
Promotion of Local Enterprise Supplier Development
1 2 3 4 5 6
No. of Jobs Created
26 45 26 20 5 26
10 15 1 0 26
Intermediate Key Performance Indicators - 2023-2024 FY
Quarterly Totals
Goals
Objectives
Number Outputs
Annual Targets
Quarter 1
Quarter 2
Quarter 3
Quarter 4
2023/24 FY
Enterprise Creation
Promotion of Local Enterprise Supplier Development
1 No. of SMMEs and Cooperatives supported in the Manufacturing sector
10
34
37
27
27 125
7
No. of SMMEs and Cooperatives supported to participated in the local markets
No. of SMMEs and Cooperatives supported to participated in the International markets
2 26 26 26 26
2 79 79 79 79
2
93
93
93
93
R35 117 341
0
52
52
52
52
R15 006 127
0
52
52
52
52
R17 976 610
4
276
276
276
276
R90 017 135
8
No. of SMMEs and Cooperatives assisted with productivity improvement
No. of SMMEs and Cooperatives assisted with quality improvement
9
10
No. of SMMEs and Cooperatives supported with training, mentorship and coaching
No. of SMMEs and Cooperatives supported in priority sector (scale-up/high growth potential)
11
12 13 14 15
Revenue generated by SMMEs
No. of SMMEs in ideation (Launch league programme) No. of SMMEs in Supplier Development Programme (SDP) No. of SMMEs and Cooperatives that graduated
R5 000 20 10 50
000
R21 917 057
0 40 24 0 0 0 14 13
Core KPIs
No. of Jobs Sustained
104 79 7 39 79
119 93 14 76 93
72 52 1 52 52
72 52 0 52 52
367 276 22 219 276
No. of clients Accessing BDS
No. of start-ups supported / No. SMMEs created
No. of Clients whose turnover increase by minimum 5%
KPIs
2 No. of Ips Commercialised
0
0 22
0 27
0 8
00 8 65
3 No. of business accessing procurement opportunities from Government and corporates 30% set aside and ESD 30%
8
4 No. of SMMEs receiving Technology Transfer support 5 % of SMMEs that have access to funding
6 No. of youth accessing BDS 70%
7 No. of women accessing BDS 30%
10
7 10 35 47 2
10 20 41 55 2
30 17 26 33 0
10 57 5 52 26 128 33 168
8 No. of people who are different able accessing BDS 7%
18 8 2
0 4
5
75 40 87 0
27
202 Cumulative Totals
64
