
Page 12 - State of Biodiversity 2023-2024
P. 12
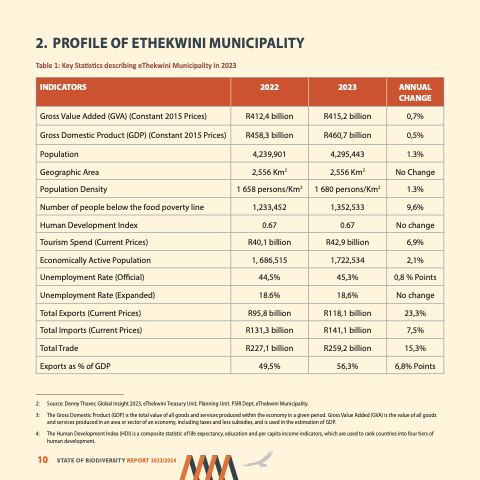
 2. PROFILE OF ETHEKWINI MUNICIPALITY
Table 1: Key Statistics describing eThekwini Municipality in 2023
Gross Value Added (GVA) (Constant 2015 Prices) Gross Domestic Product (GDP) (Constant 2015 Prices)
Population
Geographic Area
Population Density
Number of people below the food poverty line Human Development Index
Tourism Spend (Current Prices)
Economically Active Population Unemployment Rate (Official)
Unemployment Rate (Expanded)
Total Exports (Current Prices)
Total Imports (Current Prices)
Total Trade
Exports as % of GDP
R412,4 billion R458,3 billion 4,239,901 2,556 Km2
1 658 persons/Km2 1,233,452 0.67
R40,1 billion
1, 686,515 44,5% 18.6%
R95,8 billion R131,3 billion R227,1 billion 49,5%
R415,2 billion R460,7 billion 4,295,443 2,556 Km2
1 680 persons/Km2 1,352,533 0.67
R42,9 billion 1,722,534 45,3% 18,6% R118,1 billion R141,1 billion R259,2 billion 56,3%
0,7% 0,5% 1.3% No Change 1.3%
9,6%
No change 6,9% 2,1%
0,8 % Points No change 23,3% 7,5% 15,3% 6,8% Points
  INDICATORS
    2022
  2023
   ANNUAL CHANGE
                                                               2: Source: Denny Thaver, Global Insight 2023, eThekwini Treasury Unit, Planning Unit. PSIR Dept, eThekwini Municipality.
3: The Gross Domestic Product (GDP) is the total value of all goods and services produced within the economy in a given period. Gross Value Added (GVA) is the value of all goods and services produced in an area or sector of an economy, including taxes and less subsidies, and is used in the estimation of GDP.
4: The Human Development Index (HDI) is a composite statistic of life expectancy, education and per capita income indicators, which are used to rank countries into four tiers of human development.
 10 STATE OF BIODIVERSITY REPORT 2023/2024
