
Page 57 - State of Biodiversity 2023-2024
P. 57
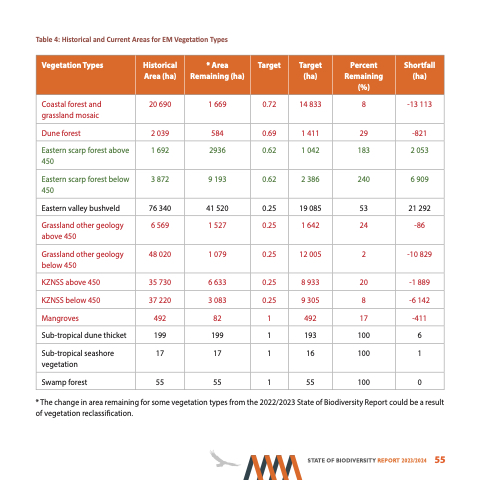
Table 4: Historical and Current Areas for EM Vegetation Types
 Vegetation Types
   Historical Area (ha)
 * Area Remaining (ha)
   Target
  Target (ha)
 Percent Remaining (%)
 Shortfall (ha)
 Coastal forest and grassland mosaic
  20 690
  1 669
  0.72
   14 833
  8
  -13 113
  Dune forest
Eastern valley bushveld
KZNSS above 450
KZNSS below 450 Mangroves
Sub-tropical dune thicket
Swamp forest
2 039
76 340
35 730 37 220 492 199
55
584
41 520
6 633 3 083 82 199
55
0.69 1 411
0.25 19 085
0.25 8 933 0.25 9 305 1 492
1 193
1 55
29 -821
53 21 292
20 -1 889 8 -6 142
17 -411
100 6
100 0
 Eastern scarp forest above 450
 1 692
 2936
 0.62
  1 042
 183
 2 053
 Eastern scarp forest below 450
  3 872
  9 193
  0.62
   2 386
  240
  6 909
  Grassland other geology above 450
  6 569
  1 527
  0.25
   1 642
  24
  -86
  Grassland other geology below 450
   48 020
 1 079
   0.25
  12 005
 2
   -10 829
                       Sub-tropical seashore vegetation
  17
  17
  1
   16
  100
  1
        * The change in area remaining for some vegetation types from the 2022/2023 State of Biodiversity Report could be a result of vegetation reclassification.
 STATE OF BIODIVERSITY REPORT 2023/2024 55
