
Page 68 - State of Biodiversity 2023-2024
P. 68
4.6. RESPONSESTOTHREATS
4.6.1. Greenhouse Gas Emissions Inventory
A Greenhouse Gas (GHG) Emissions Inventory for EM was compiled for the 2022 calendar year and was made available in the 2023/2024 municipal financial year. The inventory identifies the sources of GHG emissions from both the government and community sectors within the EMA. EM has compiled the emissions inventory to help plan climate change mitigation strategies within its jurisdiction.
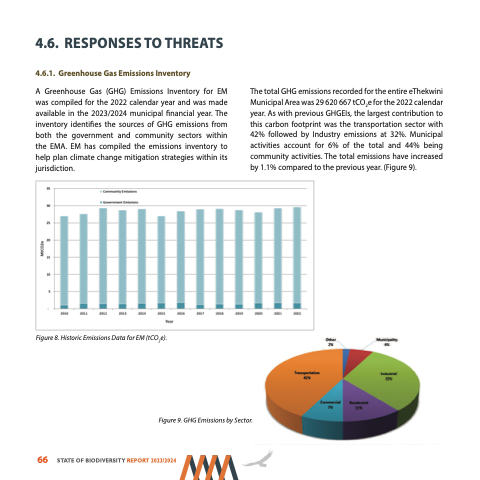
The total GHG emissions recorded for the entire eThekwini Municipal Area was 29 620 667 tCO2e for the 2022 calendar year. As with previous GHGEIs, the largest contribution to this carbon footprint was the transportation sector with 42% followed by Industry emissions at 32%. Municipal activities account for 6% of the total and 44% being community activities. The total emissions have increased by 1.1% compared to the previous year. (Figure 9).
Figure 8. Historic Emissions Data for EM (tCO2e).
66 STATE OF BIODIVERSITY REPORT 2023/2024
Figure 9. GHG Emissions by Sector.
