
Page 3 - 2018 Annual Report
P. 3
APPLIED INDUSTRIAL TECHNOLOGIES, INC. AND SUBSIDIARIES
2018 ANNUAL REPORT
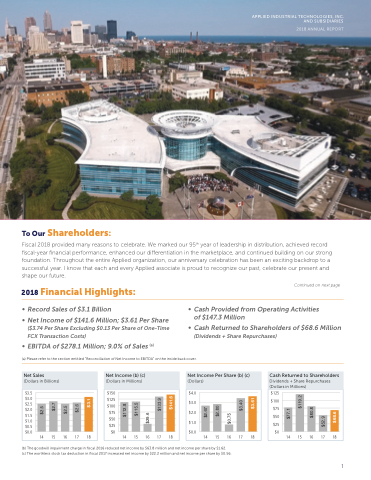
To Our Shareholders:
Fiscal 2018 provided many reasons to celebrate. We marked our 95th year of leadership in distribution, achieved record fiscal-year financial performance, enhanced our differentiation in the marketplace, and continued building on our strong foundation. Throughout the entire Applied organization, our anniversary celebration has been an exciting backdrop to a successful year. I know that each and every Applied associate is proud to recognize our past, celebrate our present and shape our future.
2018 Financial Highlights: ••Record Sales of $3.1 Billion
••Net Income of $141.6 Million; $3.61 Per Share ($3.74 Per Share Excluding $0.13 Per Share of One-Time FCX Transaction Costs)
Continued on next page
••Cash Provided from Operating Activities of $147.3 Million
••Cash Returned to Shareholders of $68.6 Million (Dividends + Share Repurchases)
••EBITDA of $278.1 Million; 9.0% of Sales (a)
(a) Please refer to the section entitled “Reconciliation of Net Income to EBITDA” on the inside back cover.
Net Sales
(Dollars in Billions)
Net Income (b) (c)
(Dollars in Millions)
Net Income Per Share (b) (c)
(Dollars)
Cash Returned to Shareholders
Dividends + Share Repurchases (Dollars in Millions)
$3.5 $3.0 $2.5 $2.0 $1.5 $1.0 $0.5 $0.0
14 15 16 17 18
$150 $125 $100
$75 $50 $25
$0
14 15 16 17 18
$4.0 $3.0 $2.0 $1.0 $0.0
14 15 16 17 18
$125 $100 $75 $50 $25 $0
14 15 16 17 18
(b) The goodwill impairment charge in fiscal 2016 reduced net income by $63.8 million and net income per share by $1.62.
(c) The worthless stock tax deduction in fiscal 2017 increased net income by $22.2 million and net income per share by $0.56.
1
$2.5 $2.7
$2.5 $2.6
$112.8 $115.5
$29.6
$133.9
$2.67 $2.80
$0.75
$3.40
$ 3.1
$ 141.6
$ 3.61
$77.1 $119.2
$80.8 $52.9
$ 68.6
