
Page 41 - WHEDAannualREPORT2016
P. 41
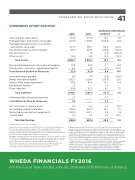
STATEMENTS OF NET POSITION
Cash and cash equivalents
Mortgage loans and interest receivable Mortgage-backed security investments
and interest receivable Investments and interest receivable Net pension asset
Other assets
Total Assets
Accumulated decrease in fair value of hedging Pension plan – Actual vs. expected outcomes Total Deferred Outflow of Resources
Accrued interest payable Bonds and notes payable Interest Rate Swap Agreements Net pension liability
Other liabilities
Total Liabilities
Deferred inflow of resource-pension
Total Deferred Inflow of Resources
Net investment in capital assets
Restricted by bond resolutions
Restricted by contractual agreements
Unrestricted 5.3
41
INCREASE/(DECREASE) 2016 2015 AMOUNT %
391.4 377.2 14.2 3.8 1,291.0 1,397.3 (106.3) (7.6)
277.5 105.1 172.4 164.0
TOGETHER WE BUILD WISCONSIN
49.4 109.2 (59.8) – 1.8 (1.8)
(54.8) (100.0) 19.4 21.6 (2.2) (10.2)
2,028.7 2,012.2 16.5 0.8
47.6 43.5 4.1 9.4 6.2 1.5 4.7 313.3 53.8 45.0 8.8 19.6
8.6 11.4 (2.8)
1,202.1 1,228.4 (26.3) (2.1) 47.6 43.5 4.1 9.4
1.2 – 1.2 – 120.6 112.5 8.1 7.2
1,380.1 1,395.8 (15.7) (1.1)
2.5 – 2.5 –
2.5 – 2.5 –
(24.6)
9.3 8.3 1.0 12.0 479.4 447.3 32.1 7.2 205.9 202.1 3.8 1.9
Total Net Position
Schedule may not foot due to rounding.
Total assets of the Authority rose by $16.5 million to $2.03 billion during 2016. The increase is due primarily to growth of the mortgage-backed security portfolio. The Authority is transitioning away from the business model that included selling single family mortgages into the secondary market and instead securitizing the mortgages and holding the investments.
Mortgage loans and interest receivable declined $106.3 million to finish the year at $1.3 billion. Mortgage backed security investments increased 164% to end the year at $277.5 million. Single Family loan originations of $256.2 million were up 66.5% over fiscal year 2015 levels and Multifamily loan originations of
$63.5 million were up 48.0% over the prior year. Even though the Authority continues to absorb high levels of prepayments, the total loan portfolio increased by 4.4% to $1,568.4 by the end of fiscal year 2016.
699.9
3.7 1.6 43.2
661.4 38.5 5.8
Liabilities remained flat at $1.4 billion. For the first time since 2010, the Authority issued revenue bonds as a source of capital to fund new First Time Home Buyer (FTHB) mortgages in the Single Family line of business. There were two Single Family bond issues in fiscal year 2016 totaling $430.2 million. FTHB loans were funded with $135.5 million of the bond proceeds with the balance of the proceeds being used to refund outstanding variable rate bonds. In addition, there were $82.8 million in bonds issued in the Multifamily program. As with the Single Family bonds, the proceeds were used to finance new mortgages and refund some existing higher rate debt.
Overall, net position, increased $38.5 million during fiscal year 2016. The various lending programs and investments within the Authority’s business segments generated the change in net position. The business segment contributions for fiscal year 2016 are as follows: $20.1 million in Single Family bond resolutions, $9.4 million in Multifamily Housing Revenue bond resolutions, $9.1 million in the General Fund (including subsidiary change in net position) and ($78,000) in State of Wisconsin Programs.
WHEDA FINANCIALS FY2016
For the Fiscal Years Ended June 30, 2016 and 2015 (Millions of dollars)
