
Page 5 - Build Your Business with RE/MAX
P. 5
All figures are full year or as of year-end 2020. ©2020 RE/MAX, LLC. Each office is independently owned and operated. 18_253738 AF
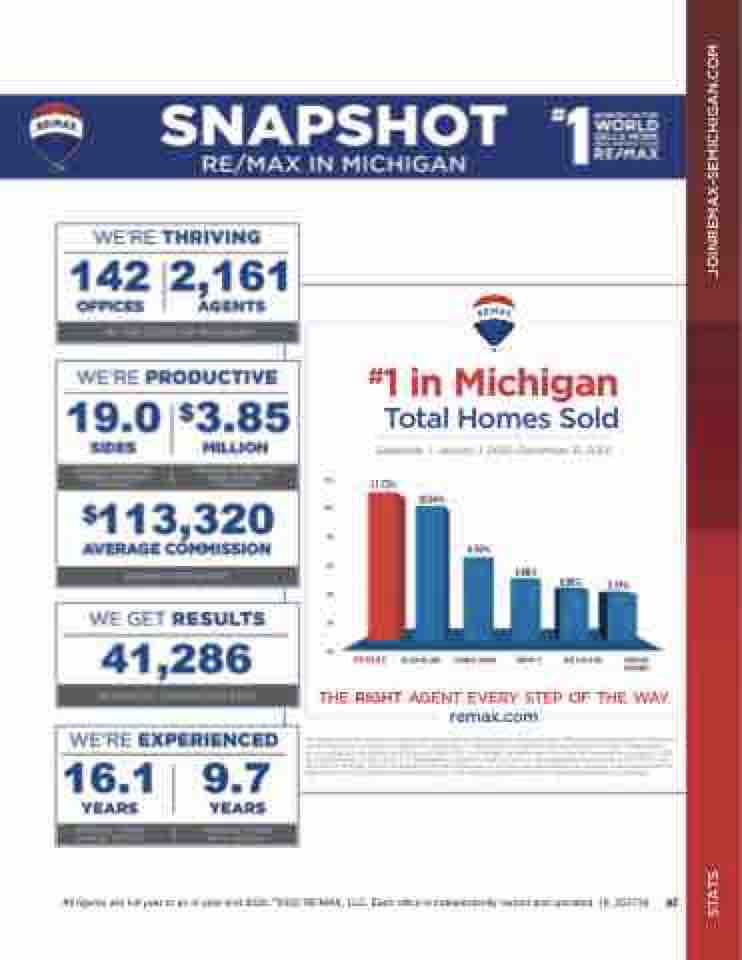
#1 in Michigan
Total Homes Sold
Statewide | January 1, 2020–December 31, 2020
12% 10% 8% 6% 4% 2% 0%
11.73%
10.66%
6.63%
COLDWELL BANKER
4.86%
4.06%
3.73%
BERKSHIRE
HATHAWAY
RE/MAX KELLER WILLIAMS
CENTURY 21
REAL ESTATE ONE
THE RIGHT AGENT EVERY STEP OF THE WAY
remax.com
This graph represents the sold residential sides of all franchise of昀ce locations and independent of昀ces of each organization identi昀ed here, whose listings were sold by such organizations themselves, or with the aid of a cooperating Broker/Owner, in Michigan. These statistics
are according to the publication of all Boards of REALTORS® and Multiple Listing Services in the state for the period from January 1, 2020 through December 31, 2020. Note: This representation is based in whole or in part on data supplied by these Boards of REALTORS® and their MLSs in Michigan. Neither the Boards nor the MLSs guarantee, or are in any way responsible for, its accuracy. Data maintained by the Boards or MLSs may not re昀ect all real estate activity in the market. Each RE/MAX® of昀ce is independently owned and operated.
STATS JOINREMAX-SEMICHIGAN.COM
