
Page 2 - Clinton Township Water Quailty Report 2018
P. 2
2
2018
Annual Drinking Water Quality Report • Section 1
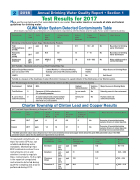
Test Results for 2017
Here are the contaminants that were detected in our water. Your water meets or exceeds all state and federal guidelines for drinking water.
GLWA Water System Detected Contaminants Table
(The results represent a combination of contaminants reported by the Northeast and the Lake Huron water treatment plants.)
Contaminant
Test Date
Units
Health Goal MCLG
Allowed Levels MCL
Highest Level Detected
Range
of Detection
Violation
Likely Source
Monitoring in Distribution System Stage 2 Disinfection By-Products
Total Trihalomethanes (TTHM)
2017
ppb
N/A
80
31.1
10.7 – 46
No
By-product of drinking water chlorination
Haloacetic Acids (HAA5)
2017
ppb
N/A
60
12
7–16
No
By-product of drinking water disinfectant
Disinfectant (chlorine)
Jan- Dec 2017
ppm
MRDLG 4
MRDL 4
.78
0.66 – 0.82
No
Water additive used to control microbes
2017 Turbidity - Monitored every 4 hours at Plant Finished Water Tap
Highest Single Measurement Can not exceed 1 NTU
Lowest Monthly % of Samples Meeting Turbidity Limit of 0.3 NTU (minimum 95%)
Violation Yes/No
Major Source in Drinking Water
.29NTU
100%
No
Soil Runoff
Turbidity is a measure of the cloudiness of water. We monitor it because it is a good indicator of the effectiveness of our filtration system.
2017 Microbiological Contaminants - Monthly Monitoring in Detroit and Mount Clemens Distribution Systems
Contaminant
MCLG
MCL
Highest
Number Detected
Violation Yes/No
Major Sources in Drinking Water
Total Coliform
0
Presence of Coliform bacteria in 5% of monthly samples
In one month 0
No
Naturally present in the environment
E. coli or fecal coliform bacteria
0
A routine sample and a repeat sample are total coliform positive, and one is also fecal or E. Coli positive
Entire year 0
No
Human waste and animal fecal waste
Charter Township of Clinton Lead and Copper Results
2017 Lead and Copper Monitoring at Customer’s Tap
Contaminant
Lead
Copper
Test Date
2017
2017
Units
ppb
ppm
Health Goal MCLG
0
1.3
Action Level AL
15
1.3
90th Percentile Value*
0.0
0.1
Number of of Samples Over AL
0
0
Violation
No
No
Major Sources in Drinking Water
Corrosion of household plumbing systems; Erosion of natural deposits.
Corrosion of household plumbing systems; Erosion of natural deposits; leaching from wood preservatives
* The 90th percentile value means 90 percent of the homes tested have lead and copper levels below the given 90th percentile value. If the 90th percentile value is above the AL additional requirements must be met.
Unregulated Contaminant
Strontium
Vanadium
Chromium (Total)
Chromium-6
Test Date
Jan – Dec 2015
Jan – Dec 2015
Jan – Dec 2015
Jan – Dec 2015
Units
ppb
ppb
ppb
ppb
Reference Concentration From EPA
1,500
21
100
N/A
Average Level Level Detected
102
0.59
0.2
0.13
Range
of Detection
90 – 110
0.45 – 0.68
0.2 – 0.34
0.03 – 0.19
Unregulated contaminants are those for which EPA has not established drinking water standards. Monitoring helps EPA to determine where these contaminants occur and whether it needs to regulate those contaminants. To the right is the report of unregulated contaminants detected during quarterly sampling and analysis performed during 2015.
VV
