
Page 13 - Paw Graphics Group
P. 13
Brochures / Sell Sheets
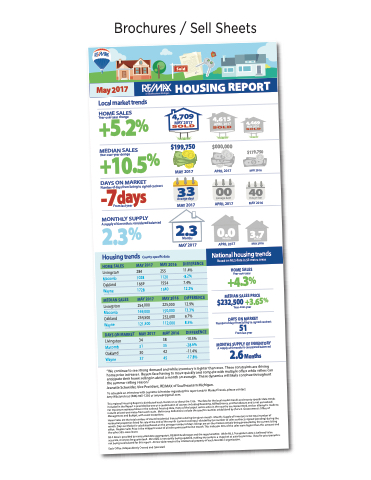
May 2017
HOUSING REPORT
Local market trends
HOME SALES Year-over-year change
4,709
+5.2%
MAY 2017
4,615
4,469
MEDIAN SALES
Year-over-year change %
$199,750
$000,000
+10.5
$179,750
DAYS ON MARKET
Number of days from listing to signed contract
33
-7days
Aveage days MAY 2017
00
40
Macomb
1028
1120
-8.2%
Year-over-year
Oakland
1669
1554
7.4%
+4.3%
Wayne
1728
1540
12.2%
MEDIAN SALES
MAY 2017
MAY 2016
DIFFERENCE
MEDIAN SALES PRICE
Livingston
254,000
225,000
12.9%
$232,500 +3.65% Year-over-year
Macomb
169,000
150,000
13.3%
From last year
APRIL 2017
MAY 2016
MONTHLY SUPPLY
A supply of 6 months is considered balanced
2.3% 2.3 Months
0.0
3.7
Housingtrends County-specificdata
National housing trends Based on MLS data in 53 metro areas
HOME SALES
MAY 2017
MAY 2016
DIFFERENCE
Livingston
284
255
11.4%
HOME SALES
Oakland 254,500 232,000 9.7%
Wayne
121,500
112,000
8.5%
DAYS ON MARKET
DAYS ON MARKET
MAY 2017
MAY 2016
DIFFERENCE
51
Livingston
34
38
-10.5%
Macomb
31
35
-28.6%
MONTHS SUPPLY OF INVENTORY
Oakland
30
42
-11.4%
A supply of 6 months is considered balanced
Wayne
37
45
-17.8%
2.6Months
Sold
MAY 2017
APRIL 2017
MAY 2016
MAY 2017
APRIL 2017
MAY 2016
“ We continue to see strong demand and while inventory is tighter than ever. These constraints are driving home price increases. Buyers face having to move quickly and compete with multiple offers while sellers can anticipate their home selling in about a month on average. These dynamics will likely continue throughout the summer selling season.”
Jeanette Schneider, Vice President, RE/MAX of Southeastern Michigan.
To schedule an interview with Jeanette Schneider regarding this report and/or Market Trends, please contact Amy Wilczynski at: (586) 945-1250 or amywpr@gmail.com.
This regional Housing Report is distributed each month on or about the 15th. The data for the local market trends and county-specific data trends included in the Report is provided by one or a combination of sources including Realcomp, MIRealSource, and Terradatum and is not annualized.
For maximum representation in the national housing data, many of the largest metro areas in the country are represented, and an attempt is made to include at least one metro from each state. Metro area definitions include the specific counties established by the U.S. Government’s Office of Management and Budget, with some exceptions.
Home Sales are the total number of closed residential transactions during the given month. Months Supply of Inventory is the total number of residential properties listed for sale at the end of the month (current inventory) divided by the number of sales contracts signed (pending) during the month. Days on Market is calculated based on the average number of days listings are on-the-market actively being promoted by the current listing office. Median Sales Price is the midpoint value of all sales processed for the month. This indicates 50% of the sales were higher than this amount and the other 50% were lower.
MLS data is provided by contracted data aggregators, RE/MAX brokerages and the regional office. While MLS, Terradatum data is believed to be accurate, it cannot be guaranteed. MLS data is constantly being updated, making any analysis a snapshot at a particular time. Data for prior periods is not being recalculated for this report. All raw data remains the intellectual property of each local MLS organization.
Each Office Independently Owned and Operated.
APRIL 2017
Aveage days
Aveage days
Months
Months
Number of days from listing to signed contract
From last year
MAY 2016
