
Page 158 - Green - Maritime Archaeology: A Technical Handbook. 2nd ed
P. 158
Chapter 4: Conventional Survey 137
the expedition, the tidal predictions for the Pandora site were obtained (Figure 4.21) and used to determine the approximate depth correction over the period of each dive.
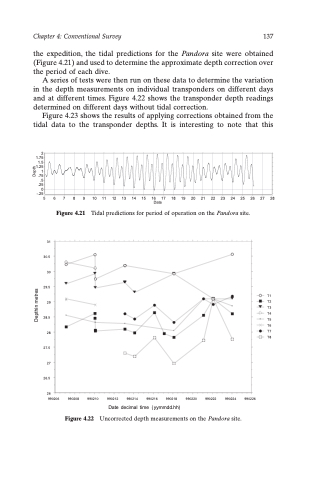
A series of tests were then run on these data to determine the variation in the depth measurements on individual transponders on different days and at different times. Figure 4.22 shows the transponder depth readings determined on different days without tidal correction.
Figure 4.23 shows the results of applying corrections obtained from the tidal data to the transponder depths. It is interesting to note that this
2 1.75 1.5 1.25 1 .75 .5 .25 0 -.25
5 6 7
8 9
10 11 12 13 14 15 16 17 18 19 20 21 22 23 24 25 26 27 28 Date
Figure 4.21 Tidal predictions for period of operation on the Pandora site.
31
30.5
30
29.5
29
28.5
28
27.5
27
26.5
26
990206 990208 990210
T1 T2 T3 T4 T5 T6 T7 T8
990212 990214
Date decimal time (yymmdd.hh)
990224 990226
990216 990218 990220 990222
Figure 4.22 Uncorrected depth measurements on the Pandora site.
Depthin metres
Depth
