
Page 234 - Green - Maritime Archaeology: A Technical Handbook. 2nd ed
P. 234
Chapter 7: Site Plans and Geographical Information Systems 213
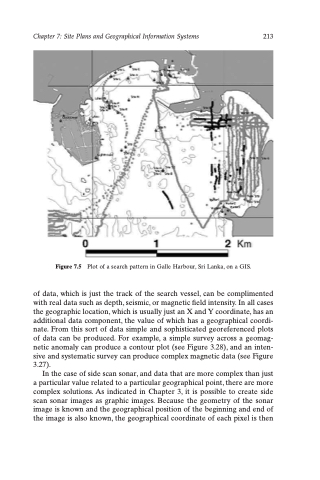
Figure 7.5 Plot of a search pattern in Galle Harbour, Sri Lanka, on a GIS.
of data, which is just the track of the search vessel, can be complimented with real data such as depth, seismic, or magnetic field intensity. In all cases the geographic location, which is usually just an X and Y coordinate, has an additional data component, the value of which has a geographical coordi- nate. From this sort of data simple and sophisticated georeferenced plots of data can be produced. For example, a simple survey across a geomag- netic anomaly can produce a contour plot (see Figure 3.28), and an inten- sive and systematic survey can produce complex magnetic data (see Figure 3.27).
In the case of side scan sonar, and data that are more complex than just a particular value related to a particular geographical point, there are more complex solutions. As indicated in Chapter 3, it is possible to create side scan sonar images as graphic images. Because the geometry of the sonar image is known and the geographical position of the beginning and end of the image is also known, the geographical coordinate of each pixel is then
