
Page 84 - Green - Maritime Archaeology: A Technical Handbook. 2nd ed
P. 84
Chapter 3: Search and Survey 63
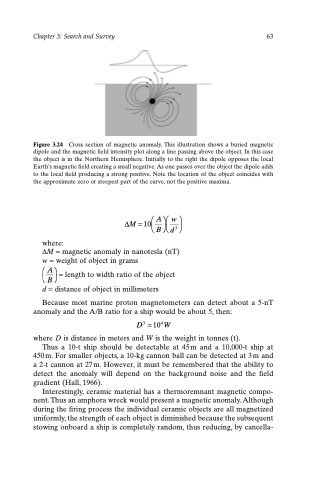
Figure 3.24 Cross section of magnetic anomaly. This illustration shows a buried magnetic dipole and the magnetic field intensity plot along a line passing above the object. In this case the object is in the Northern Hemisphere. Initially to the right the dipole opposes the local Earth’s magnetic field creating a small negative. As one passes over the object the dipole adds to the local field producing a strong positive. Note the location of the object coincides with the approximate zero or steepest part of the curve, not the positive maxima.
where:
DM = magnetic anomaly in nanotesla (nT) w = weight of object in grams
Ê Aˆ = length to width ratio of the object Ë B¯
d = distance of object in millimeters
Because most marine proton magnetometers can detect about a 5-nT
anomaly and the A/B ratio for a ship would be about 5, then:
D3 =104W
where D is distance in meters and W is the weight in tonnes (t).
Thus a 10-t ship should be detectable at 45m and a 10,000-t ship at 450 m. For smaller objects, a 10-kg cannon ball can be detected at 3 m and a 2-t cannon at 27 m. However, it must be remembered that the ability to detect the anomaly will depend on the background noise and the field
gradient (Hall, 1966).
Interestingly, ceramic material has a thermoremnant magnetic compo-
nent. Thus an amphora wreck would present a magnetic anomaly. Although during the firing process the individual ceramic objects are all magnetized uniformly, the strength of each object is diminished because the subsequent stowing onboard a ship is completely random, thus reducing, by cancella-
DM = 10Ê AˆÊ w ˆ Ë B¯Ë d3 ¯
