
Page 87 - Green - Maritime Archaeology: A Technical Handbook. 2nd ed
P. 87
66 Maritime Archaeology: A Technical Handbook, Second Edition
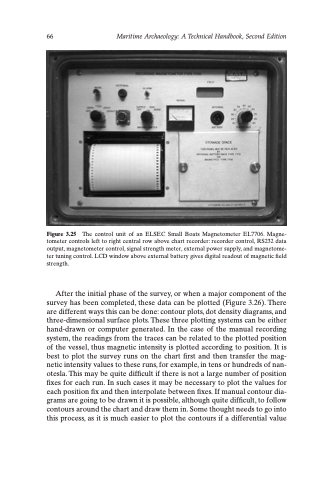
Figure 3.25 The control unit of an ELSEC Small Boats Magnetometer EL7706. Magne- tometer controls left to right central row above chart recorder: recorder control, RS232 data output, magnetometer control, signal strength meter, external power supply, and magnetome- ter tuning control. LCD window above external battery gives digital readout of magnetic field strength.
After the initial phase of the survey, or when a major component of the survey has been completed, these data can be plotted (Figure 3.26). There are different ways this can be done: contour plots, dot density diagrams, and three-dimensional surface plots. These three plotting systems can be either hand-drawn or computer generated. In the case of the manual recording system, the readings from the traces can be related to the plotted position of the vessel, thus magnetic intensity is plotted according to position. It is best to plot the survey runs on the chart first and then transfer the mag- netic intensity values to these runs, for example, in tens or hundreds of nan- otesla. This may be quite difficult if there is not a large number of position fixes for each run. In such cases it may be necessary to plot the values for each position fix and then interpolate between fixes. If manual contour dia- grams are going to be drawn it is possible, although quite difficult, to follow contours around the chart and draw them in. Some thought needs to go into this process, as it is much easier to plot the contours if a differential value
