
Page 30 - ConcreCem - State of the Art
P. 30
Samples were tested for flexural - and compressive strength according to EN 196-1 and are shown in Table 5.1
Unfortunately the available flexural strength testing equipment reached its limits on measurement after 3 days. Our own
laboratory has no possibility to monitor the flexural strength up to 28 days. Consequently these performed in a different laboratory. The conclusions and findings will be added to this report.
Figure 4.1 shows the prism after flexural strength testing. The micro steel fibres, which keep the together, are clearly visible.
Table 10.3: density, flexural and compressive strength prisms according to EN 196-1
tests will therefore be two parts of the prism
7,5 103,8
144,9 181,4
samples
date
D
preparing
testing
[kg/m3]
Rf
Fc
Rc
[N/mm2]
[kN]
[N/mm2]
90415-M3
15-04-09
1 2
8 28
Ff [kN]
16-04-09 2440 1,56 3,5 12,0 17-04-09 2460 > 10 > 22 166,0
23-04-09 2460 - - 231,8
13-05-09
2490 - - 290,2
Rate of load compressive strength: 2400 ± 200 N/sec
Fc: Maximum compressive load at failure [kN] Rc: Compressive strength [N/mm2]
Remarks:
Rate of load flexural strength: 50 ± 10 N/sec
D: Density samples [kg/m3]
Ff: Maximum flexural load at failure [kN] Rf: Flexural strength [N/mm2]
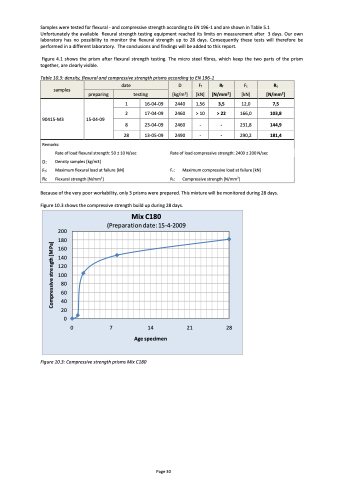
Because of the very poor workability, only 3 prisms were prepared. This mixture will be monitored during 28 days. Figure 10.3 shows the compressive strength build up during 28 days.
200
180
160
140
120
100
80 60 40 20
Mix C180
(Preparation date: 15-4-2009
0
0 7 14 21 28
Age specimen
Figure 10.3: Compressive strength prisms Mix C180
Page 30
Compressive strength [MPa]
