
Page 43 - AHEIA Annual Report
P. 43
2016 2015
$$
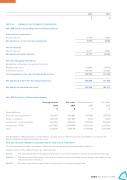
NOTE 14 FINANCIAL INSTRUMENTS (CONTINUED)
Note 14B: Net Income and Expense from Financial Assets
Cash and cash equivalents
Interest revenue
Net gain/(loss) on cash and cash equivalents
Held-to-maturity
Interest revenue
Net gain/(loss) held-to-maturity
Fair value through pro t and loss
Designated as fair value through pro t and loss: Change in fair value
Investment revenue
Total designated as fair value through pro t and loss
Net gain/(loss) at fair value through pro t and loss Net gain/(loss) from nancial assets
Note 14C: Fair Value of Financial Instruments
Carrying amount 2016
3,593
3,593
16,777
16,777
39,444 155,640 195,084
195,084 215,454
1,071,691 1,071,691 9,303 9,303 100,000 100,000 t2,152,792 2,152,792 3,333,786 3,333,786
9,045
9,045
25,163
25,163
(38,511) 170,036 131,525
131,525 165,733
Financial Assets
Cash and cash equivalents
Trade receivables
Investments – held to maturity
Investments - FVTPL
Total 3,356,114
330,967
330,967
205,079 550,000 2,270,068 3,356,114
205,079 550,000 2,270,068
The Committee of Management consider that the carrying amount of nancial assets and liabilities recorded in the nancial statements approximate their fair value.
FAIR VALUE MEASUREMENTS CATEGORISED BY FAIR VALUE HIERARCHY
The following table provides an analysis of nancial instruments that are measured at fair value, by valuation method. The di erent levels are de ned below:
Level 1: Level 2:
Fair value obtained from unadjusted quoted prices in active markets for identical instruments indirectly.
Fair value derived from inputs other than quoted prices included within Level 1 that are observable for the instrument, either directly or
Fair value derived from inputs that are not based on observable market data
Level 3:
Fair value 2016
Fair value 2015 $$$$
Carrying amount 2015
AHEIA Annual Report 2016 43
