
Page 13 - The Negotiator Mag 52pp
P. 13
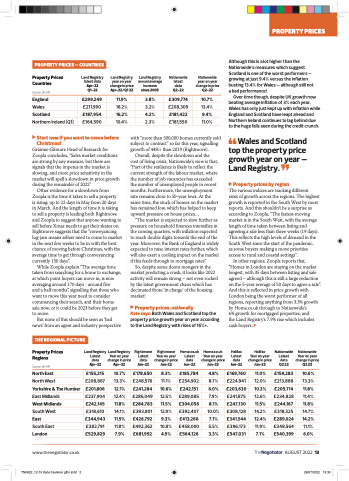
           PROPERTY PRICES – COUNTRIES
Although this is a lot higher than the Nationwide’s measures which suggest Scotland is one of the worst performers – growing at just 9.4% versus the inflation busting 13.4% for Wales – although still not a bad performance!
Over time though, despite UK growth now beating average inflation of 3% each year, Wales has only just kept up with inflation while England and Scotland have leapt ahead and Northern Ireland continues to lag behind due to the huge falls seen during the credit crunch.
Wales and Scotland top the property price growth year on year – Land Registry.
Property prices by region
The various indices are tracking different
rates of growth across the regions. The highest growth is reported in the South West by most reports. And this shouldn’t be a surprise as according to Zoopla, “The fastest-moving market is in the South West, with the average length of time taken between listing and agreeing a sale less than three weeks (19 days). This reflects the high levels of demand in the South West since the start of the pandemic,
as some buyers making a move prioritise access to rural and coastal settings“.
Property Prices Countries
Source: UK HPI
England
Wales
Scotland
Northern Ireland (Q1)
Land Registry latest data Apr-22 Q1-22
Land Registry year on year change in price Apr-22/Q1 22
Land Registry annual average increase since 2005
Nationwide latest data Q2-22
Nationwide year on year change in price Q2-22
10.7%
13.4%
9.4%
11.0%
 £299,249
11.9%
3.8%
£309,774
£211,990
16.2%
3.2%
£208,309
£187,954
16.2%
4.2%
£181,422
£164,590
10.4%
2.3%
£181,550
Start now if you want to move before
Christmas!
Gráinne Gilmore Head of Research for Zoopla concludes, “Sales market conditions are strong by any measure, but there are signals that the impetus in the market is slowing, and more price sensitivity in the market will spell a slowdown in price growth during the remainder of 2022”
Other evidence for a slowdown from Zoopla is the time it takes to sell a property
is rising: up to 22 days in May from 20 days
in March. And the length of time it is taking to sell a property is leading both Rightmove and Zoopla to suggest that anyone wanting to sell before Xmas needs to get their skates on. Rightmove suggests that the “conveyancing log-jam means sellers need to come to market in the next few weeks to be in with the best chance of moving before Christmas, with the average time to get through conveyancing currently 150 days”.
While Zoopla explain “The average time taken from searching for a home to exchange, at which point buyers can move in, is now averaging around 170 days - around five andahalfmonths”,signallingthatthosewho want to move this year need to consider commencing their search, and their home sale now, or it could be 2023 before they get to move.
But none of this should be seen as ‘bad news’ from an agent and industry perspective
THE REGIONAL PICTURE
with “more than 500,000 homes currently sold subject to contract” so far this year, signalling growth of 44%+ than 2019 (Rightmove).
Overall, despite the slowdown and the cost of living crisis, Nationwide’s view is that, “Part of the resilience is likely to reflect the current strength of the labour market, where the number of job vacancies has exceeded the number of unemployed people in recent months. Furthermore, the unemployment rate remains close to 50-year lows. At the same time, the stock of homes on the market has remained low, which has helped to keep upward pressure on house prices...
 “The market is expected to slow further as
pressure on household finances intensifies in
the coming quarters, with inflation expected
to reach double digits towards the end of the
year. Moreover, the Bank of England is widely
expected to raise interest rates further, which
will also exert a cooling impact on the market
ifthisfeedsthroughtomortgagerates”. Inotherregions,Zooplareportsthat,
So, despite some doom mongers in the market predicting a crash, it looks like 2022 activity will remain strong – not even rocked by the latest government chaos which has decimatedthose‘incharge’ofthehousing market!
Property prices, nationally
Kate says: Both Wales and Scotland top the property price growth year on year according to the Land Registry with rises of 16%+.
“Homes in London are staying on the market longest, with 35 days between listing and sale agreed – although this is still a large reduction on the 5-year average of 50 days to agree a sale”. Andthisisreflectedinpricegrowthwith London being the worst performer of all regions, reporting anything from 3.3% growth by Home.co.uk through to Nationwide’s
6% growth for mortgaged properties, and the Land Registry’s 7.9% rise which includes cash buyers.
 Property Prices Regions
Source: UK HPI
North East
North West
Yorkshire & The Humber
East Midlands
West Midlands
South West
East
South East
London
www.thenegotiator.co.uk
TN0822_12-15 Kate Faulkner glfin.indd 2
Land Registry Land Registry
Rightmove Latest data Jun-22
Rightmove Year on year change in price Jun-22
Home.co.uk Latest data Jun-22
Home.co.uk
Year on year change in price Jun-22
Halifax Latest data Jun-22
Halifax Year on year change in price Jun-22
Nationwide Latest data Q2 22
Nationwide Year on year change in price Q2 22
10.6%
13.3%
11.8%
11.4%
11.8%
14.7%
14.2%
11.1%
6.0%
Latest data Apr-22
Year on year change in price Apr-22
           £155,215
10.7%
£178,650
8.3%
£185,784
4.8%
£169,760
11.0%
£159,283
£208,867
13.3%
£248,576
11.1%
£254,902
8.7%
£224,941
12.0%
£213,888
£201,806
12.1%
£241,284
10.6%
£242,151
6.0%
£203,630
10.3%
£205,714
£237,904
12.4%
£286,049
12.5%
£289,085
7.9%
£241,875
12.6%
£234,828
£242,145
11.8%
£284,783
11.5%
£304,056
8.1%
£247,130
11.5%
£244,167
£318,610
14.1%
£393,801
12.9%
£392,407
10.0%
£308,128
14.2%
£318,325
£344,943
11.9%
£426,792
9.3%
£413,266
7.1%
£341,544
12.4%
£289,024
£382,791
11.9%
£492,362
10.8%
£458,000
5.5%
£396,173
11.9%
£348,564
£529,829
7.9%
£681,992
4.9%
£564,126
3.3%
£547,031
7.1%
£540,399
           AUGUST2022 13 28/07/2022
13:30
          PROPERTY PRICES
