
Page 107 - Scopus Scholarly Utilisation By Malaysian Public Tertiary Institutions 2020/21
P. 107
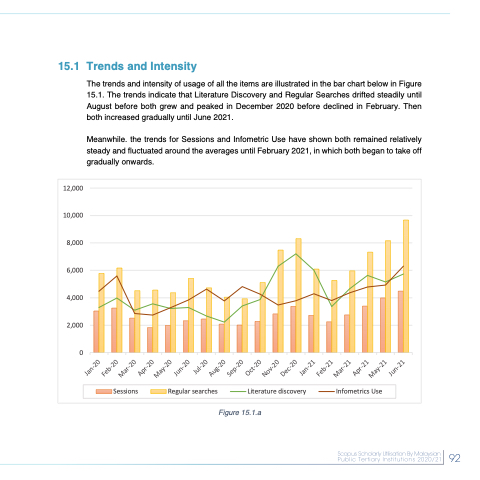
  15.1 Trends and Intensity
The trends and intensity of usage of all the items are illustrated in the bar chart below in Figure 15.1. The trends indicate that Literature Discovery and Regular Searches drifted steadily until August before both grew and peaked in December 2020 before declined in February. Then both increased gradually until June 2021.
Meanwhile. the trends for Sessions and Infometric Use have shown both remained relatively steady and fluctuated around the averages until February 2021, in which both began to take off gradually onwards.
  12,000 10,000 8,000 6,000 4,000 2,000 0
                                                                Sessions Regular searches Literature discovery Infometrics Use
Figure 15.1.a
 92
 92
 Jan-20 Feb-20
Mar-20 Apr-20
May-20 Jun-20
Jul-20 Aug-20
Sep-20 Oct-20
Nov-20 Dec-20
Jan-21 Feb-21
Mar-21 Apr-21
May-21 Jun-21
