
Page 115 - Scopus Scholarly Utilisation By Malaysian Public Tertiary Institutions 2020/21
P. 115
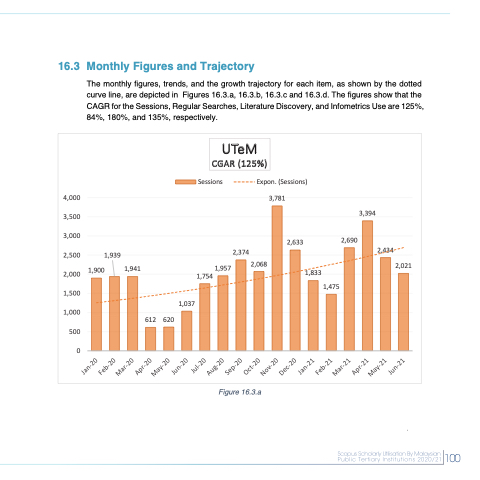
  16.3 Monthly Figures and Trajectory
The monthly figures, trends, and the growth trajectory for each item, as shown by the dotted curve line, are depicted in Figures 16.3.a, 16.3.b, 16.3.c and 16.3.d. The figures show that the CAGR for the Sessions, Regular Searches, Literature Discovery, and Infometrics Use are 125%, 84%, 180%, and 135%, respectively.
   4,000 3,500 3,000 2,500 2,000 1,500 1,000
500 0
Sessions
1,754 1,957
Expon. (Sessions)
3,781
       1,939 1,900
2,374
3,394
2,434 2,021
    1,941
             612 620
1,037
UTeM CGAR (125%)
2,068
2,633
2,690
1,833 1,475
    Figure 16.3.a
 100
 100
 Jan-20 Feb-20
Mar-20 Apr-20
May-20 Jun-20
Jul-20 Aug-20
Sep-20 Oct-20
Nov-20 Dec-20
Jan-21 Feb-21
Mar-21 Apr-21
May-21 Jun-21
