
Page 133 - Scopus Scholarly Utilisation By Malaysian Public Tertiary Institutions 2020/21
P. 133
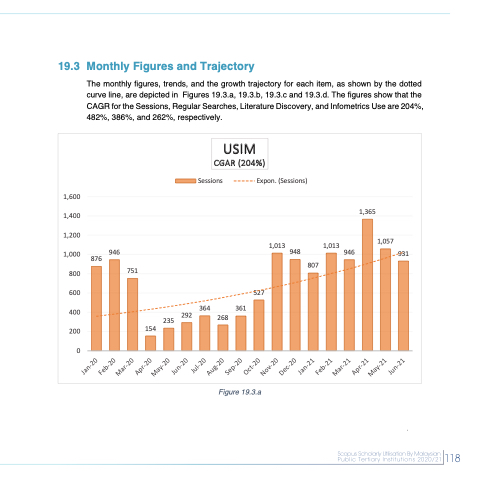
  19.3 Monthly Figures and Trajectory
The monthly figures, trends, and the growth trajectory for each item, as shown by the dotted curve line, are depicted in Figures 19.3.a, 19.3.b, 19.3.c and 19.3.d. The figures show that the CAGR for the Sessions, Regular Searches, Literature Discovery, and Infometrics Use are 204%, 482%, 386%, and 262%, respectively.
   1,600 1,400 1,200 1,000
  800
  600
  400
  200
0
1,365
876 946
931
Sessions
Expon. (Sessions)
1,013 948
     1,013 946
1,057
        751
    527 235 292 364 361
USIM CGAR (204%)
  268
807
    154
     Figure 19.3.a
 118
 118
 Jan-20 Feb-20
Mar-20 Apr-20
May-20 Jun-20
Jul-20 Aug-20
Sep-20 Oct-20
Nov-20 Dec-20
Jan-21 Feb-21
Mar-21 Apr-21
May-21 Jun-21
