
Page 151 - Scopus Scholarly Utilisation By Malaysian Public Tertiary Institutions 2020/21
P. 151
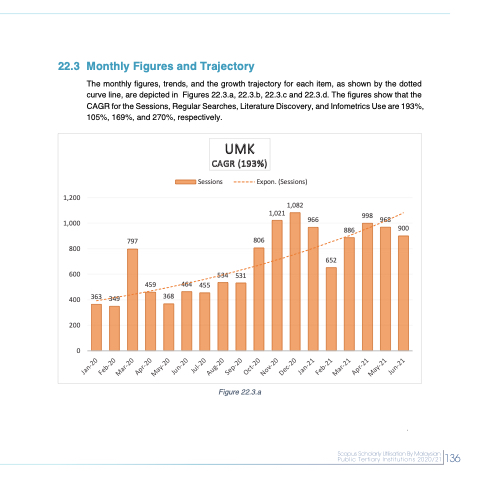
  22.3 Monthly Figures and Trajectory
The monthly figures, trends, and the growth trajectory for each item, as shown by the dotted curve line, are depicted in Figures 22.3.a, 22.3.b, 22.3.c and 22.3.d. The figures show that the CAGR for the Sessions, Regular Searches, Literature Discovery, and Infometrics Use are 193%, 105%, 169%, and 270%, respectively.
   1,200 1,000 800 600
400 363 349 200
0
1,021 1,082
966 998 968
900
Sessions
Expon. (Sessions)
         797
806
      459
464 455
534 531
  368
UMK CAGR (193%)
652
886
         Figure 22.3.a
 136
 136
 Jan-20 Feb-20
Mar-20 Apr-20
May-20 Jun-20
Jul-20 Aug-20
Sep-20 Oct-20
Nov-20 Dec-20
Jan-21 Feb-21
Mar-21 Apr-21
May-21 Jun-21
