
Page 61 - Scopus Scholarly Utilisation By Malaysian Public Tertiary Institutions 2020/21
P. 61
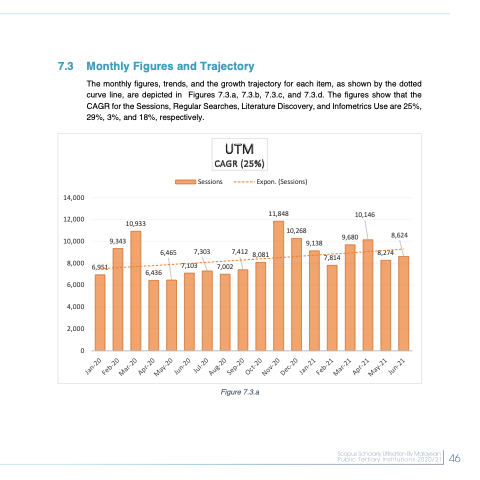
  7.3 Monthly Figures and Trajectory
The monthly figures, trends, and the growth trajectory for each item, as shown by the dotted curve line, are depicted in Figures 7.3.a, 7.3.b, 7.3.c, and 7.3.d. The figures show that the CAGR for the Sessions, Regular Searches, Literature Discovery, and Infometrics Use are 25%, 29%, 3%, and 18%, respectively.
   14,000 12,000 10,000
8,000 6,000 4,000 2,000
0
10,933 9,343
6,951
10,146
8,624 8,274
6,465 6,436
7,303 7,412 8,081 7,103 7,002
Sessions
Expon. (Sessions)
11,848
10,268 9,138
UTM CAGR (25%)
     9 680 7 814
       ,
,
                Figure 7.3.a
 46
 46
 Jan-20 Feb-20
Mar-20 Apr-20
May-20 Jun-20
Jul-20 Aug-20
Sep-20 Oct-20
Nov-20 Dec-20
Jan-21 Feb-21
Mar-21 Apr-21
May-21 Jun-21
