
Page 110 - Simplicity is Key in CRT
P. 110
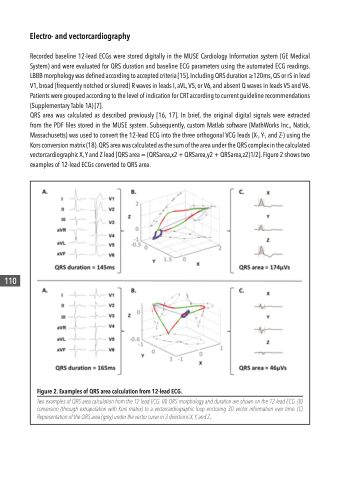
  Figure 2. Examples of QRS area calculation from 12-lead ECG.
Two examples of QRS area calculation from the 12 lead ECG. (A) QRS morphology and duration are shown on the 12 lead ECG. (B) conversion (through extrapolation with Kors matrix) to a vectorcardiographic loop enclosing 3D vector information over time. (C) Representation of the QRS area (grey) under the vector curve in 3 directions X, Y, and Z.
 110
 Electro- and vectorcardiography
Recorded baseline 12-lead ECGs were stored digitally in the MUSE Cardiology Information system (GE Medical System) and were evaluated for QRS duration and baseline ECG parameters using the automated ECG readings. LBBB morphology was defined according to accepted criteria [15]. Including QRS duration ≥120ms, QS or rS in lead V1, broad (frequently notched or slurred) R waves in leads I, aVL, V5, or V6, and absent Q waves in leads V5 and V6. Patients were grouped according to the level of indication for CRT according to current guideline recommendations (Supplementary Table 1A) [7].
QRS area was calculated as described previously [16, 17]. In brief, the original digital signals were extracted from the PDF files stored in the MUSE system. Subsequently, custom Matlab software (MathWorks Inc., Natick, Massachusetts) was used to convert the 12-lead ECG into the three orthogonal VCG leads (X-, Y-, and Z-) using the Kors conversion matrix (18). QRS area was calculated as the sum of the area under the QRS complex in the calculated vectorcardiographic X, Y and Z lead [QRS area = (QRSarea,x2 + QRSarea,y2 + QRSarea,z2)1/2]. Figure 2 shows two examples of 12-lead ECGs converted to QRS area.
